

It was another slow month for Michigan oil & gas activity like it has been every month since the initial hype of High Volume Hydraulic Fracturing (HVHF) came to our state in 2010. Five years ago we were sold a bill of goods about how HVHF was going to revolutionize hydrocarbon production in our state. The last 5 years, however, have been the slowest in Michigan’s oil & gas exploration history.
Some people think there’s a drilling frenzy coming in Michigan and dream of their Jed Clampett style payday. Some think there’s a drilling frenzy coming and fear the impending doom of a fracing industry growing across our state like a virus. Both of those seemingly opposite schools of thought have more in common than you think, they’re both based in fantasy. As far as permitting goes, this year is on pace to be the slowest year in Michigan’s 88 year history of keeping track of permit numbers.
1931 was the slowest year on record in Michigan permitting history at 111 permits for the year. So far this year, we have 54 permits through six months of activity. If we extrapolate (54 * 2) we would have 108 permits for the year which would be the lowest on record. And, considering that many wells this year are two-for-one (i.e. two permits are issued for a single well with a horizontal leg) we have even less permits than the 54 reported through June 26, 2015.

RMP went on record with this post in November 2014 talking about how primary oil & gas reservoirs in Michigan had been conventionally depleted over the past 88 years. We have consistently shown in the first six editions of our Michigan Oil & Gas Monthly magazine data and facts to support what we have reported. Our conclusions and projections about this being the slowest time in Michigan oil & gas exploration history continue to be supported by the numbers. We still see few signs of new energy production on the horizon and very limited numbers of new jobs in this industry despite property tax abatements recently granted to oil & gas operators that we were told would spur job growth. We will continue to demonstrate the numbers and data supporting our points as true until the message picks up resonance. Some people continue to choose to believe Michigan produces substantial energy and jobs from its crude resources; we continue to prove these claims are not based in fact.
Out of 365 days in a year, Michigan only produces enough oil to refine about 17 days worth of gasoline/diesel consumption by Michigan consumers. This is according to data published by the EIA using the most generous and conservative number parameters allowable. This equates to Michigan producing less than 5% of what we use and that is a number that will continue to decline. Think about that: Michigan imports over 95% of the fuel we use for transportation when new technologies could allow us to be 100% energy independent and even a net exporter of energy by creating Michigan jobs building new infrastructure.

The numbers are irrefutable. These are facts. Michigan is a very lopsided net importer of oil and refined oil products. This will not only never change as long as we rely on oil based transportation fuels, it will continue to go the other way. These are facts and they’re open for peer review and challenge. Have a different view point? Leave a comment and let us know.
With no new signs of Michigan oil & gas exploration growth on the horizon, we turn our sights in new direction related to oil & gas in Michigan: abandoned and leaking oil & gas infrastructure. We have noticed a trend of the MDEQ’s OOGM granting a well status of Temporarily Abandoned (TA) to many wells month after month. We think it’s time to ask the question: How long is temporary?
64 wells were granted TA status in March of 2015. 28 more wells were granted TA status in April of 2015. Again this month, we have 42 more wells granted TA status. How many years in a row can a location been granted TA status & what are the criteria? Who is keeping an eye on these wells? How do we keep an eye on these wells? Where are these wells? Are these wells responsible for ground water contamination? Are these wells living up to the promise the operator made in the Environmental Impact Assessment contained in the well file? These are questions that are not easily answered and have not been asked in a public forum. We endeavor to find answers to these questions to start the conversation about Michigan’s energy future and the responsibilities of our past.
Using our database and web tools, we continue to identify wells that are abandoned and wells and facilities that pollute Michigan ground water. Now that Michigan oil & gas activity is unquestionably in its denouement, it’s time we make sure that all abandoned and polluting infrastructure is properly cleaned up and accounted for. Soon we will be releasing location specific data that is searchable on our map so you can find oil & gas infrastructure that has been legally abandoned in our woods. We will have demonstration videos on how simple it is to use our map searching software so you can find this infrastructure near your home or summer cabin.
Companies in Michigan will continue to pull a permit here and there, complete a well here or there, and even have a new well wind up on production. As long as that continues to happen, we will report it. But, what’s important now is that we start to look at the hundreds of wells that litter our woods with rusty pumpjacks, leaking condensate tanks, ruptured flowlines, and contaminated ground water.
We need to take an accurate accounting of what it will take to restore these locations back to their original condition and how much money it will cost. Every single well file in Michigan states there will be no negative environmental impact and that the site condition will be restored to its original condition or better. We continue to focus our efforts on making an accurate accounting of the validity of that statement.
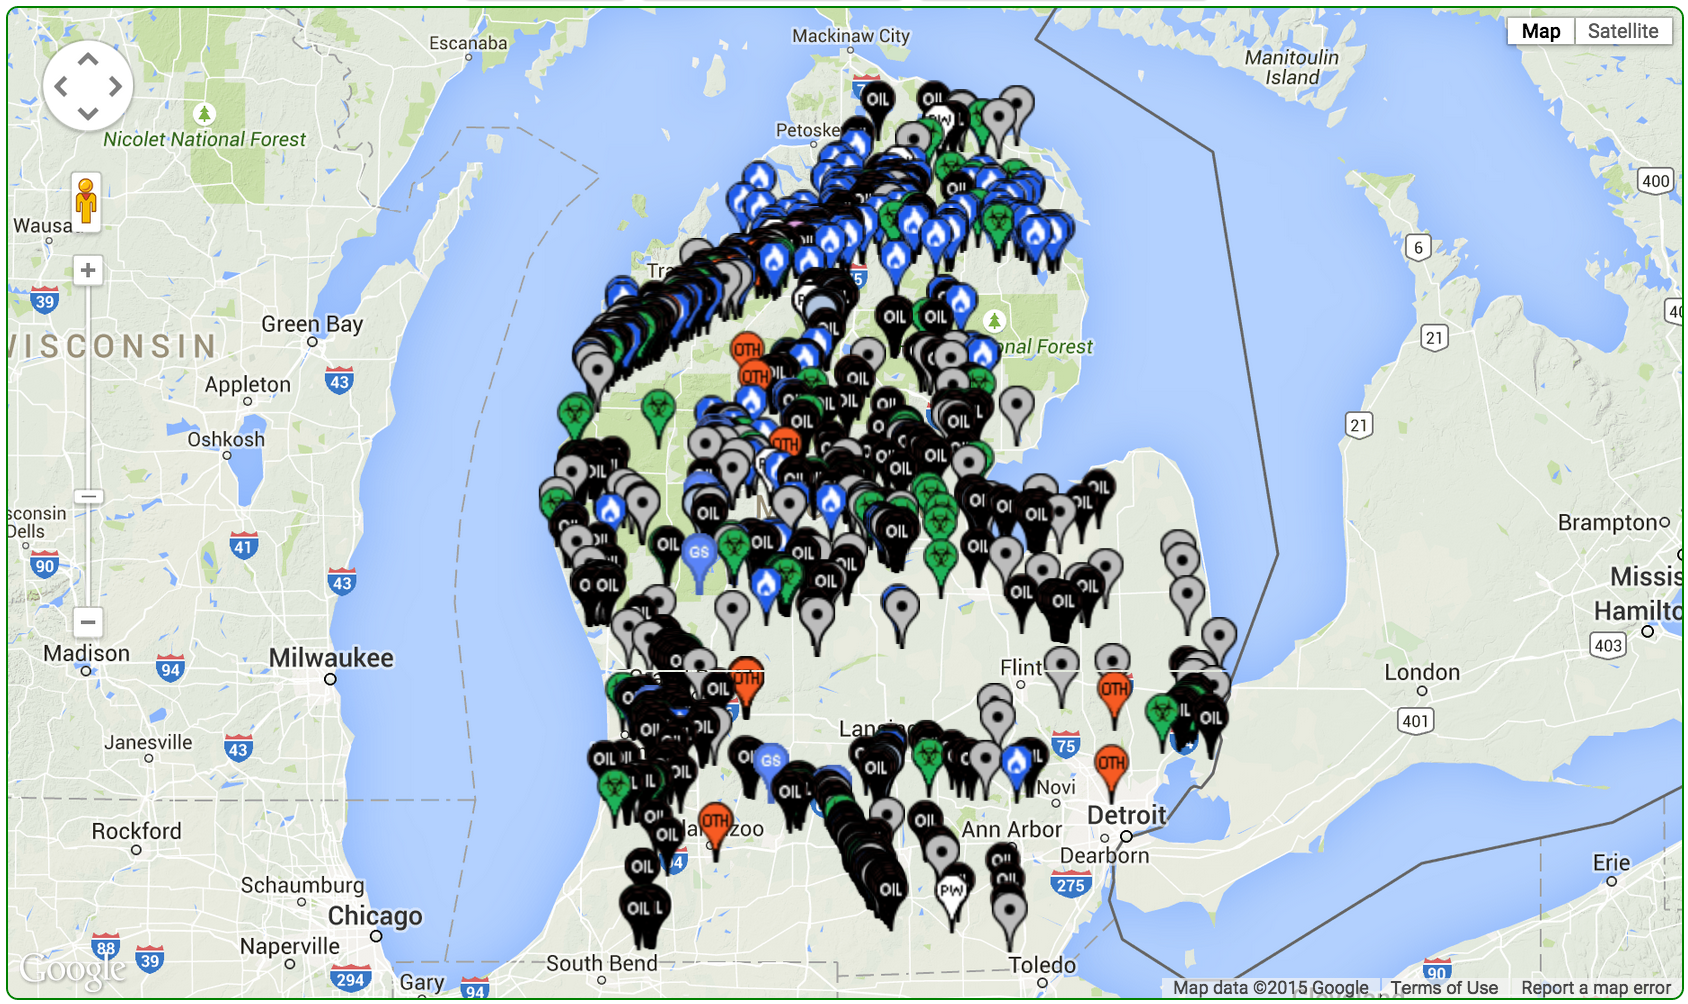
We will start with the locations we know of and expand from there. If you click on this link, you can see a map of 1,709 locations where we know soil or groundwater contamination occurred as a result of a spill. Some of these 1,709 locations will be a case closed. Some of the locations will still be in active remediation. These wells need to be investigated and ranked to see which is which. Has it been fully remediated or does it still need work? Documentation about the location should be attached to the location’s homepage to make it easy for the public to access information about ground water impacts. If you can access an internet connection, you should be able to find this information easily in order to be an informed public. Many more locations will be found as we continue to do our research and add information to our searchable database & map. The locations on the map to start primarily come from the 1993 SAP list which was discontinued when Governor Engler originally split the MDNR into the MDEQ & MDNR. The software RMP uses will allow us to roll that 1993 list up to 2015 and help keep it current. With help from the Google Maps APIv3, everyone can interact with this public data easily in a visual way and contribute information to the public database.
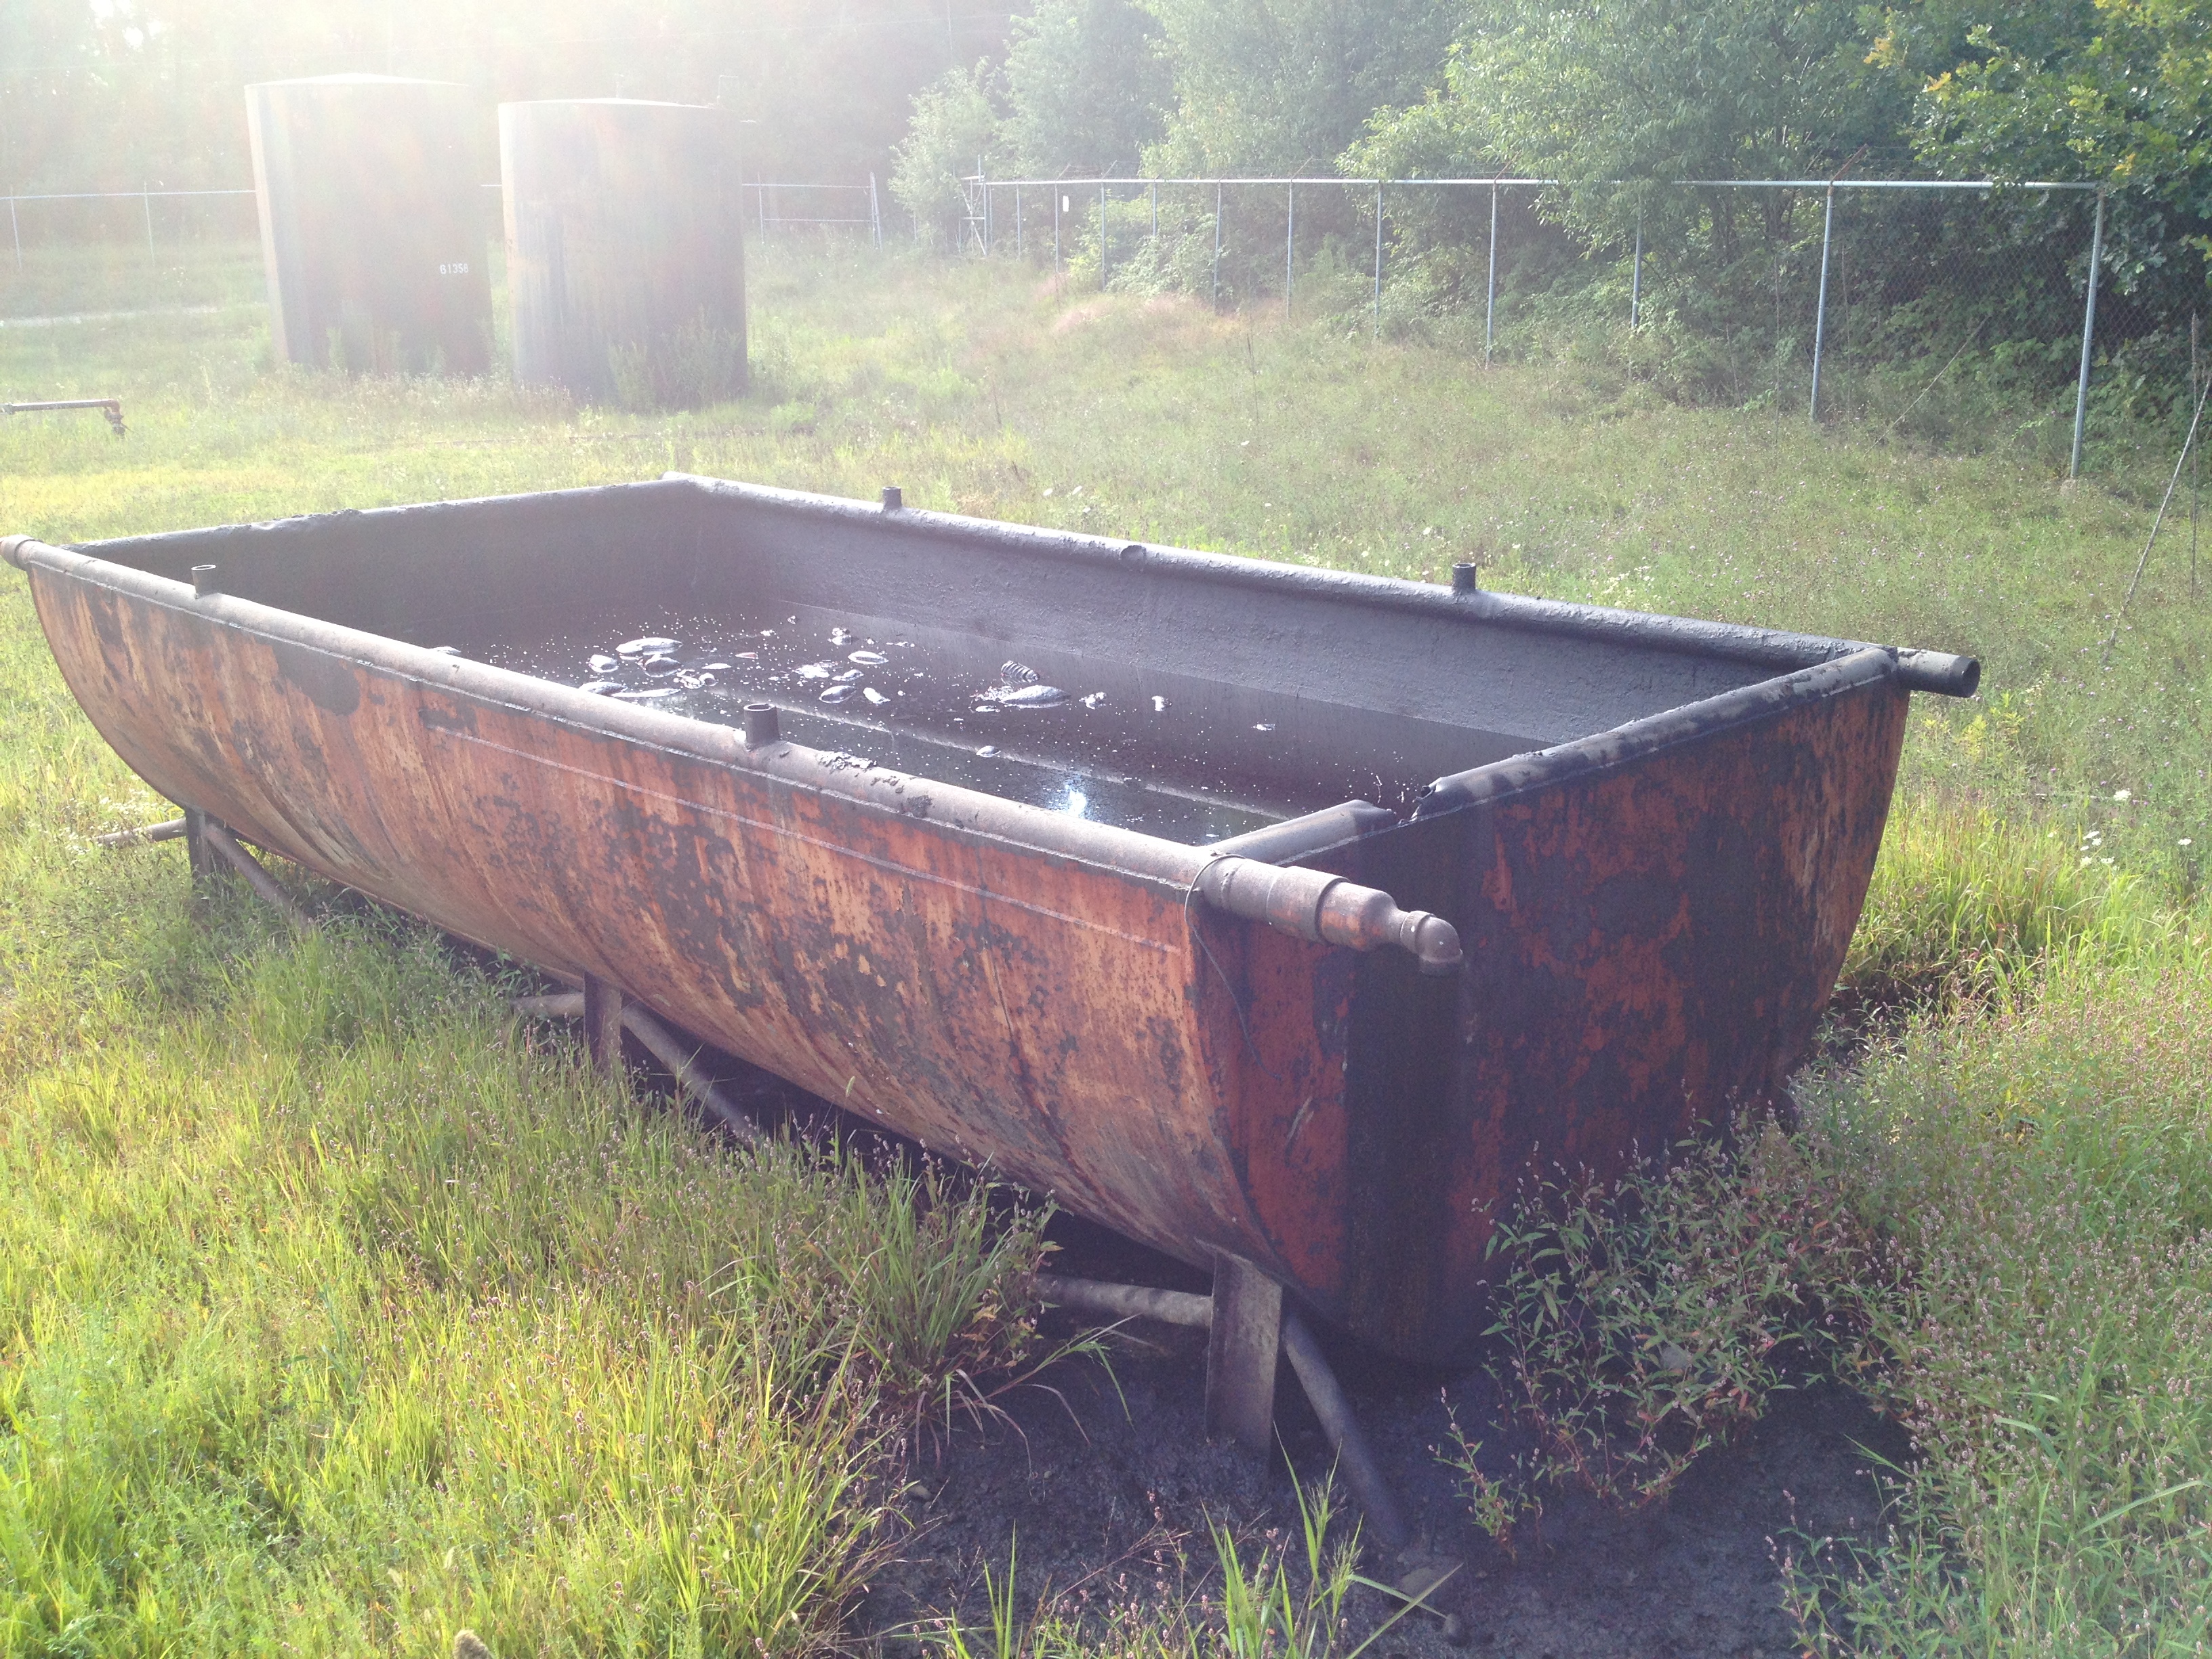
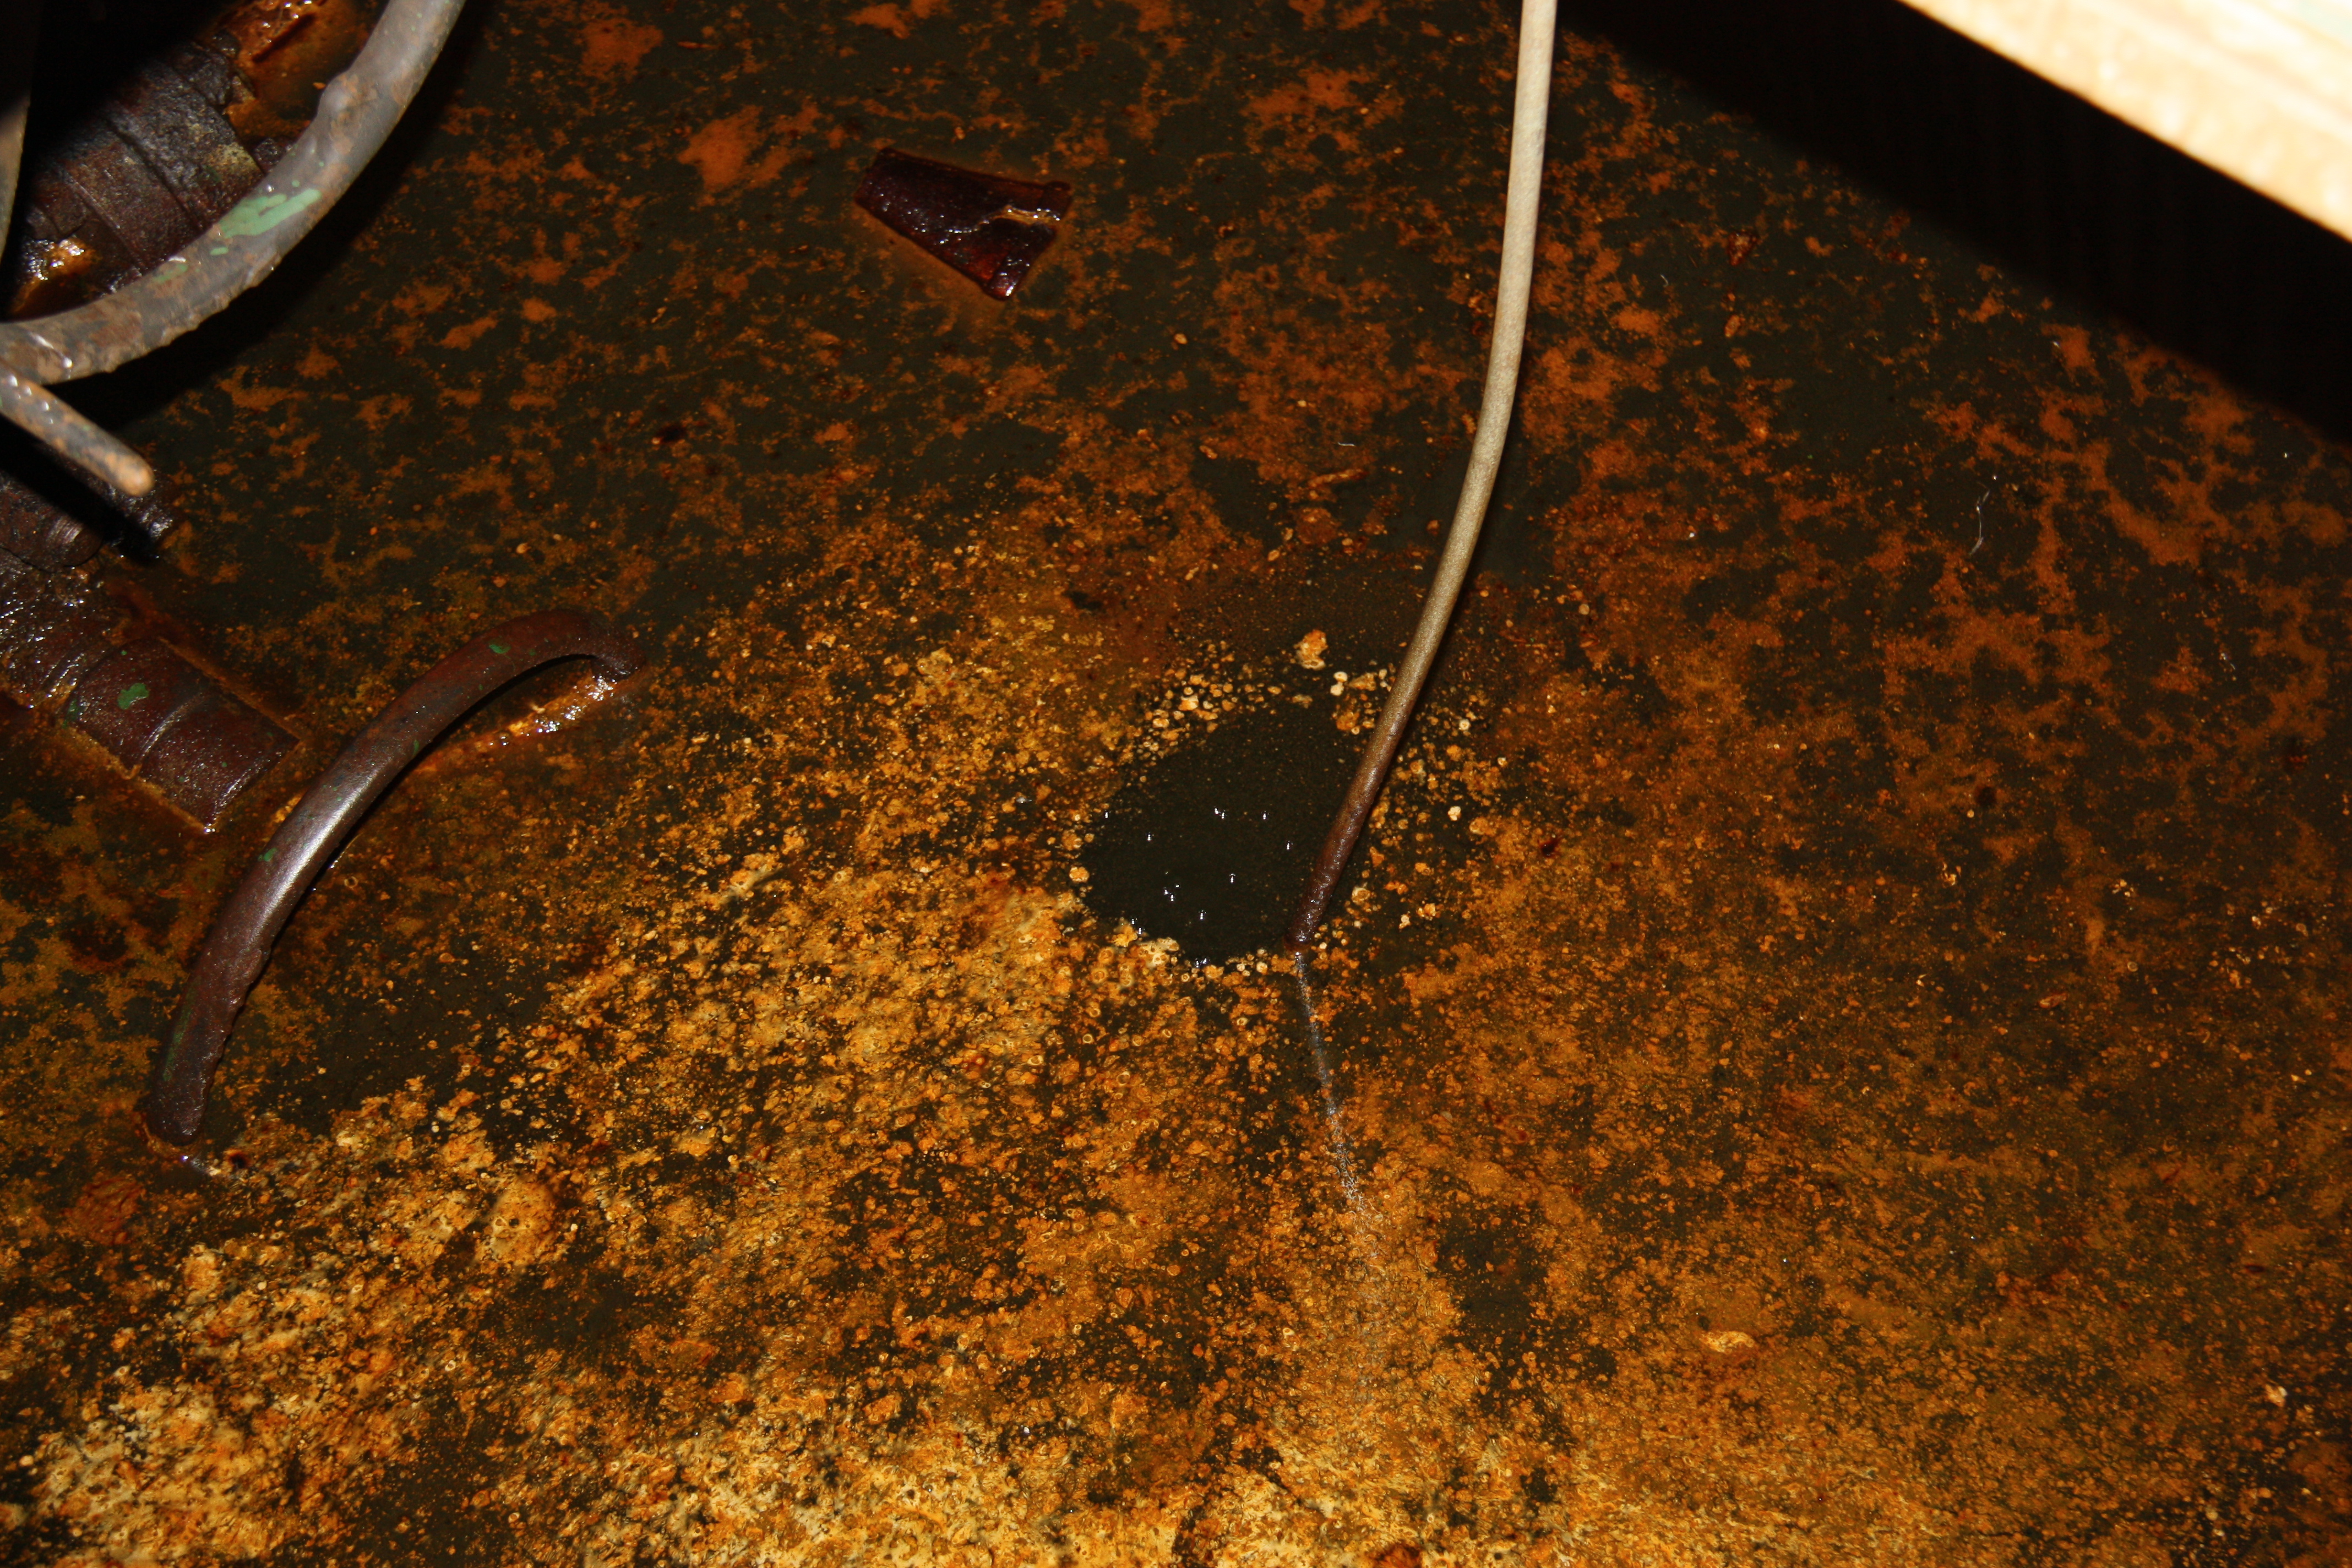
The featured image in this month’s post is not one of the 1,709 locations with confirmation of a spill on the list even though oil soaks the ground underneath the catch basin. It’s just an abandoned tank battery sitting in the middle of the woods in Hillsdale Michigan. Tanks sit in lined pits and have rusted there for years. The wells hooked up to the tank battery in the picture have not produced anything for over a decade. There are literally hundreds of locations like this where the well file promise has not been fulfilled because the well is allowed to hold a lease with meager production of a barrel or two of oil per day or the site has been legally granted Temporary Abandoned status. We intend to keep inventorying these types of locations and adding them to our map so we can try to understand better the true costs of oil production and storage to Michigan taxpayers.
Now let’s take a look at the numbers for June 2015 activity in the Michigan Basin:
11 new applications for wells were received by the MDEQ’s OOGM through 6/26/2015. These were for 10 oil wells and 1 waste well. Paxton is applying for more activity in Washtenaw county and Wyotex is again applying for permits in Grand Traverse county. This time Wyotex lists the Niagaran Gray as their target while all their other applications/permits have listed the A1 as a target.

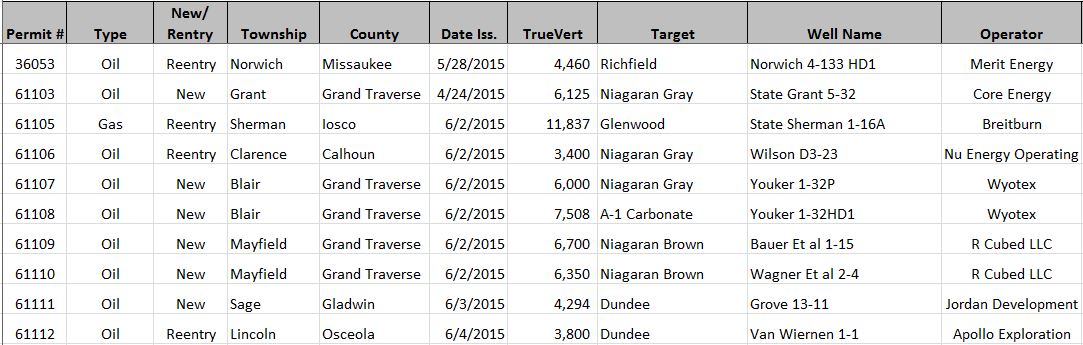
10 new permits were issued in Michigan in the month of June bringing the YTD total up to 54 as mentioned earlier in this post. Wyotex was issued vertical & horizontal permits again targeting the A1 in Grand Traverse county in Blair Township. Mel Kiogima, the Senior Geologist who covers Grand Traverse county, says that as of June 30, 2015, Wyotex has not started any activity on the permits they’ve been issued.
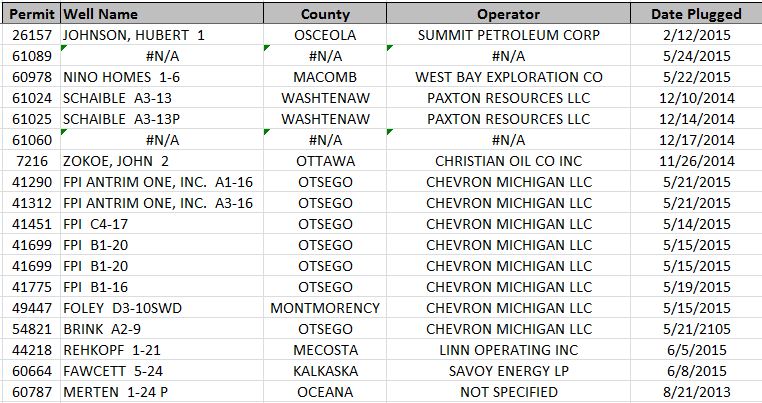
18 wells were reported plugged in June 2015. One of the wells listed was the Merten 1-24P which is on our homepage. This plugging may just be the plugging back of the pilot hole and does not necessarily mean the well is completely plugged. Through June 26, 2015 there have been a total of 128 wells reported plugged year to date.
Key Performance Indicators
Although there is not a direct proportion between apps and permits to wells drilled and completed, there is a direct relationship between applications made, permits issued, wells drilled, and wells completed. Below are some key performance indicators or KPI’s in the Michigan oil patch that can be helpful in supporting the findings we publish.
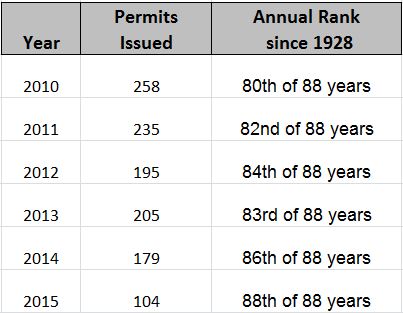
The 5 Year Trend Number of Permits Issued Per Year KPI:
The number of permits issued each year and their associated rank out of 88 years indicates this is the slowest oil & gas exploration period of Michigan’s oil & gas history. This month, I’ve added 2015 to the trend to show that the last 6 years of oil & gas exploration history are clearly the slowest 6 years in our 88 year history. 2015 is extrapolated at 54 permits times 2 given that we are half way through the current year.
The Apps to Plugs Ratio KPI:
The apps to plugs ratio is self explanatory. By looking at the number of applications to wells plugged KPI we can see wells coming vs wells going. This KPI along with the previous one supports our original 2014 & 2015 outlook post with more numbers and data.
2015 Apps to Plugs Ratio KPI:
49 Applications : 128 Wells Plugged
The Permits to Plugs Ratio KPI:
The permits to plugs ratio is nearly the same as the apps:plugs ratio but with permits instead of applications.
2015 Permits to Plugs Ratio KPI:
54 Permits Issued : 128 Wells Plugged
That’s it for the June 2015 MOGM. The story this month is that despite rumors of a oil & gas boom in Michigan we are on pace to have the slowest year in Michigan’s 88 year history. This is a story we have been talking about on this blog since November of 2014. But, as you can see, not only are we on pace for the slowest year in Michigan history, we are unquestionably in the slowest 6 years of Michigan’s 88 year history.
It has been an unpopular issue to use science, data, and facts to demonstrate the decline of oil & gas production in Michigan. If you care about Michigan workers and jobs in Michigan, you cannot deny these facts much longer or continue to ignore them. Workers in this industry are going to need jobs in new energy fields. We need to focus on jobs and make sure we create jobs for Michigan workers in energy production endeavors that can grow and are sustainable as the oil exploration industry wanes toward extinction in Michigan.
Michigan only produces less than 5% of the oil we consume. Michigan produces about 20% of the natural gas we consume. Technologies like fuel cells and Fuel Cell Electric Vehicles (FCEVs) can be powered by hydrogen which can be made from almost anything. We can make hydrogen from garbage, municipal wastes, wood waste, water, and landfill gas. Michigan can be 100% energy independent by migrating away from subsurface produced hydrocarbons. Not only can Michigan be energy independent, we can create good jobs embracing new technologies like waste gasification plants which can eliminate the need for landfills which threaten our ground water resources.
Most new energy technologies like coal gasification, waste gasification, solar electrolysis of water, and creating H2 fueling stations have one major hurdle: initial investment costs. The initial cost of creating new energy sources is a barrier for entry that must be overcome to help Michigan workers. We need clean and sustainable energy sources that have good long term paybacks, create jobs, do not risk ground water contamination, and get us out of a dead end energy sources. Investments in Michigan’s energy future and an energy infrastructure looking forward instead of backward will create jobs and protect our freshwater resources for future generations. Tick tock.

Great stuff, as usual, Matt. Thanks for the informative read.
While reading, a a few questions arose. Don’t know if you have the answers, but whatever light you can shed on them would be appreciate:
1. I assume that the decline in Michigan oil production is the result of low global oil prices?
2. Why do companies abandon wells and at what stage of the process?
3. You mentioned leaking infrastructure in Michigan. How are we aware of this? I’m sure that our “environmentally conscious” friends at the MDEQ do not publish this information.
I agree with you that the MDEQ and oil companies need to be held accountable for any leaking infrastructure. With that in mind, I plan to write them to see what they are doing about this.
Thanks again, Matt!
Steve
Steve,
I’ll do my best to answer your questions:
1) Yes, oil prices are playing a big part in the slowdown of Michigan activity. If an operator believes that money out will be less than money in, the operator will not move forward with a project. Oil prices affect the probabilities used in that equation. It’s always about the money.
2) Operators could abandon a well for a number of reasons but primarily it is because the cost to operate the well is greater than the revenue from the well. The operator might think that oil prices will be higher in the future, so the operator will suspend production until the well is more profitable. It’s always about the money.
3) RMP supports and appreciates the hard working men and women of the MDEQ and MDNR. RMP gets the much of the information we publish from the MDEQ. And yes, the MDEQ is aware of abandoned and leaking infrastructure. RMP currently lists 206 oil & gas well/facility locations with confirmed ground water contamination and over 400 locations that are Temporarily Abandoned. There are 100s more locations where wells produce very little oil that are considered active and are allowed to hold leases of taxpayer owned land for very low prices. It is a good idea to write the MDEQ and ask questions about these locations. Does it make economic sense to allow locations that pollute our groundwater and provide very little income to our state to occupy land we own? These are fair questions to ask of our legislators and the MDEQ.
Thanks for reading.
Thanks, Matt!