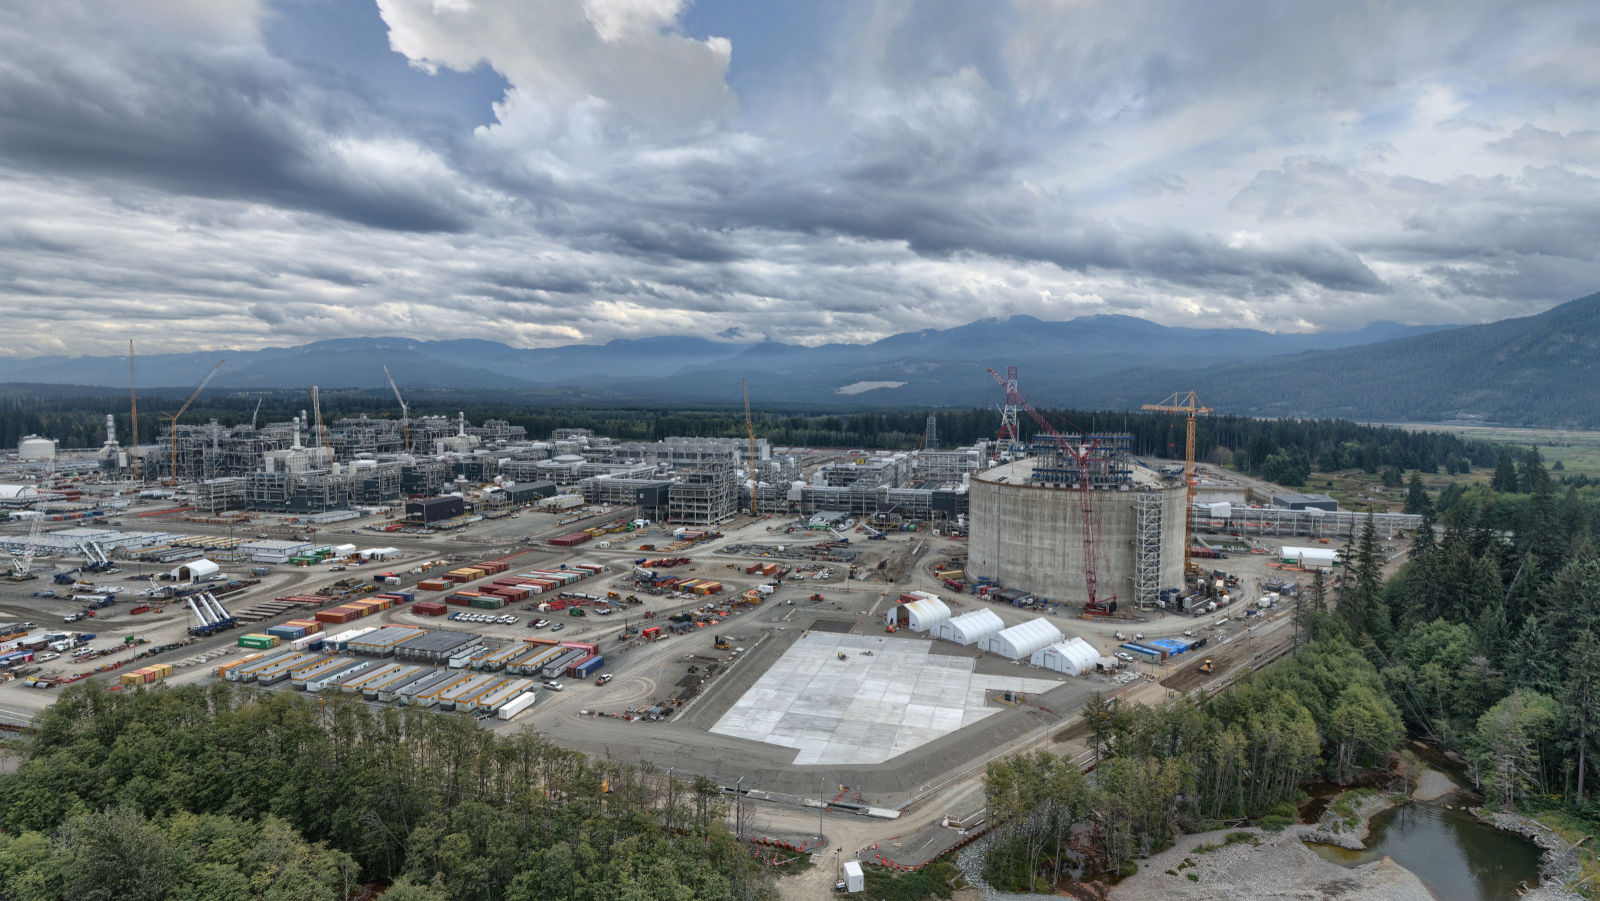
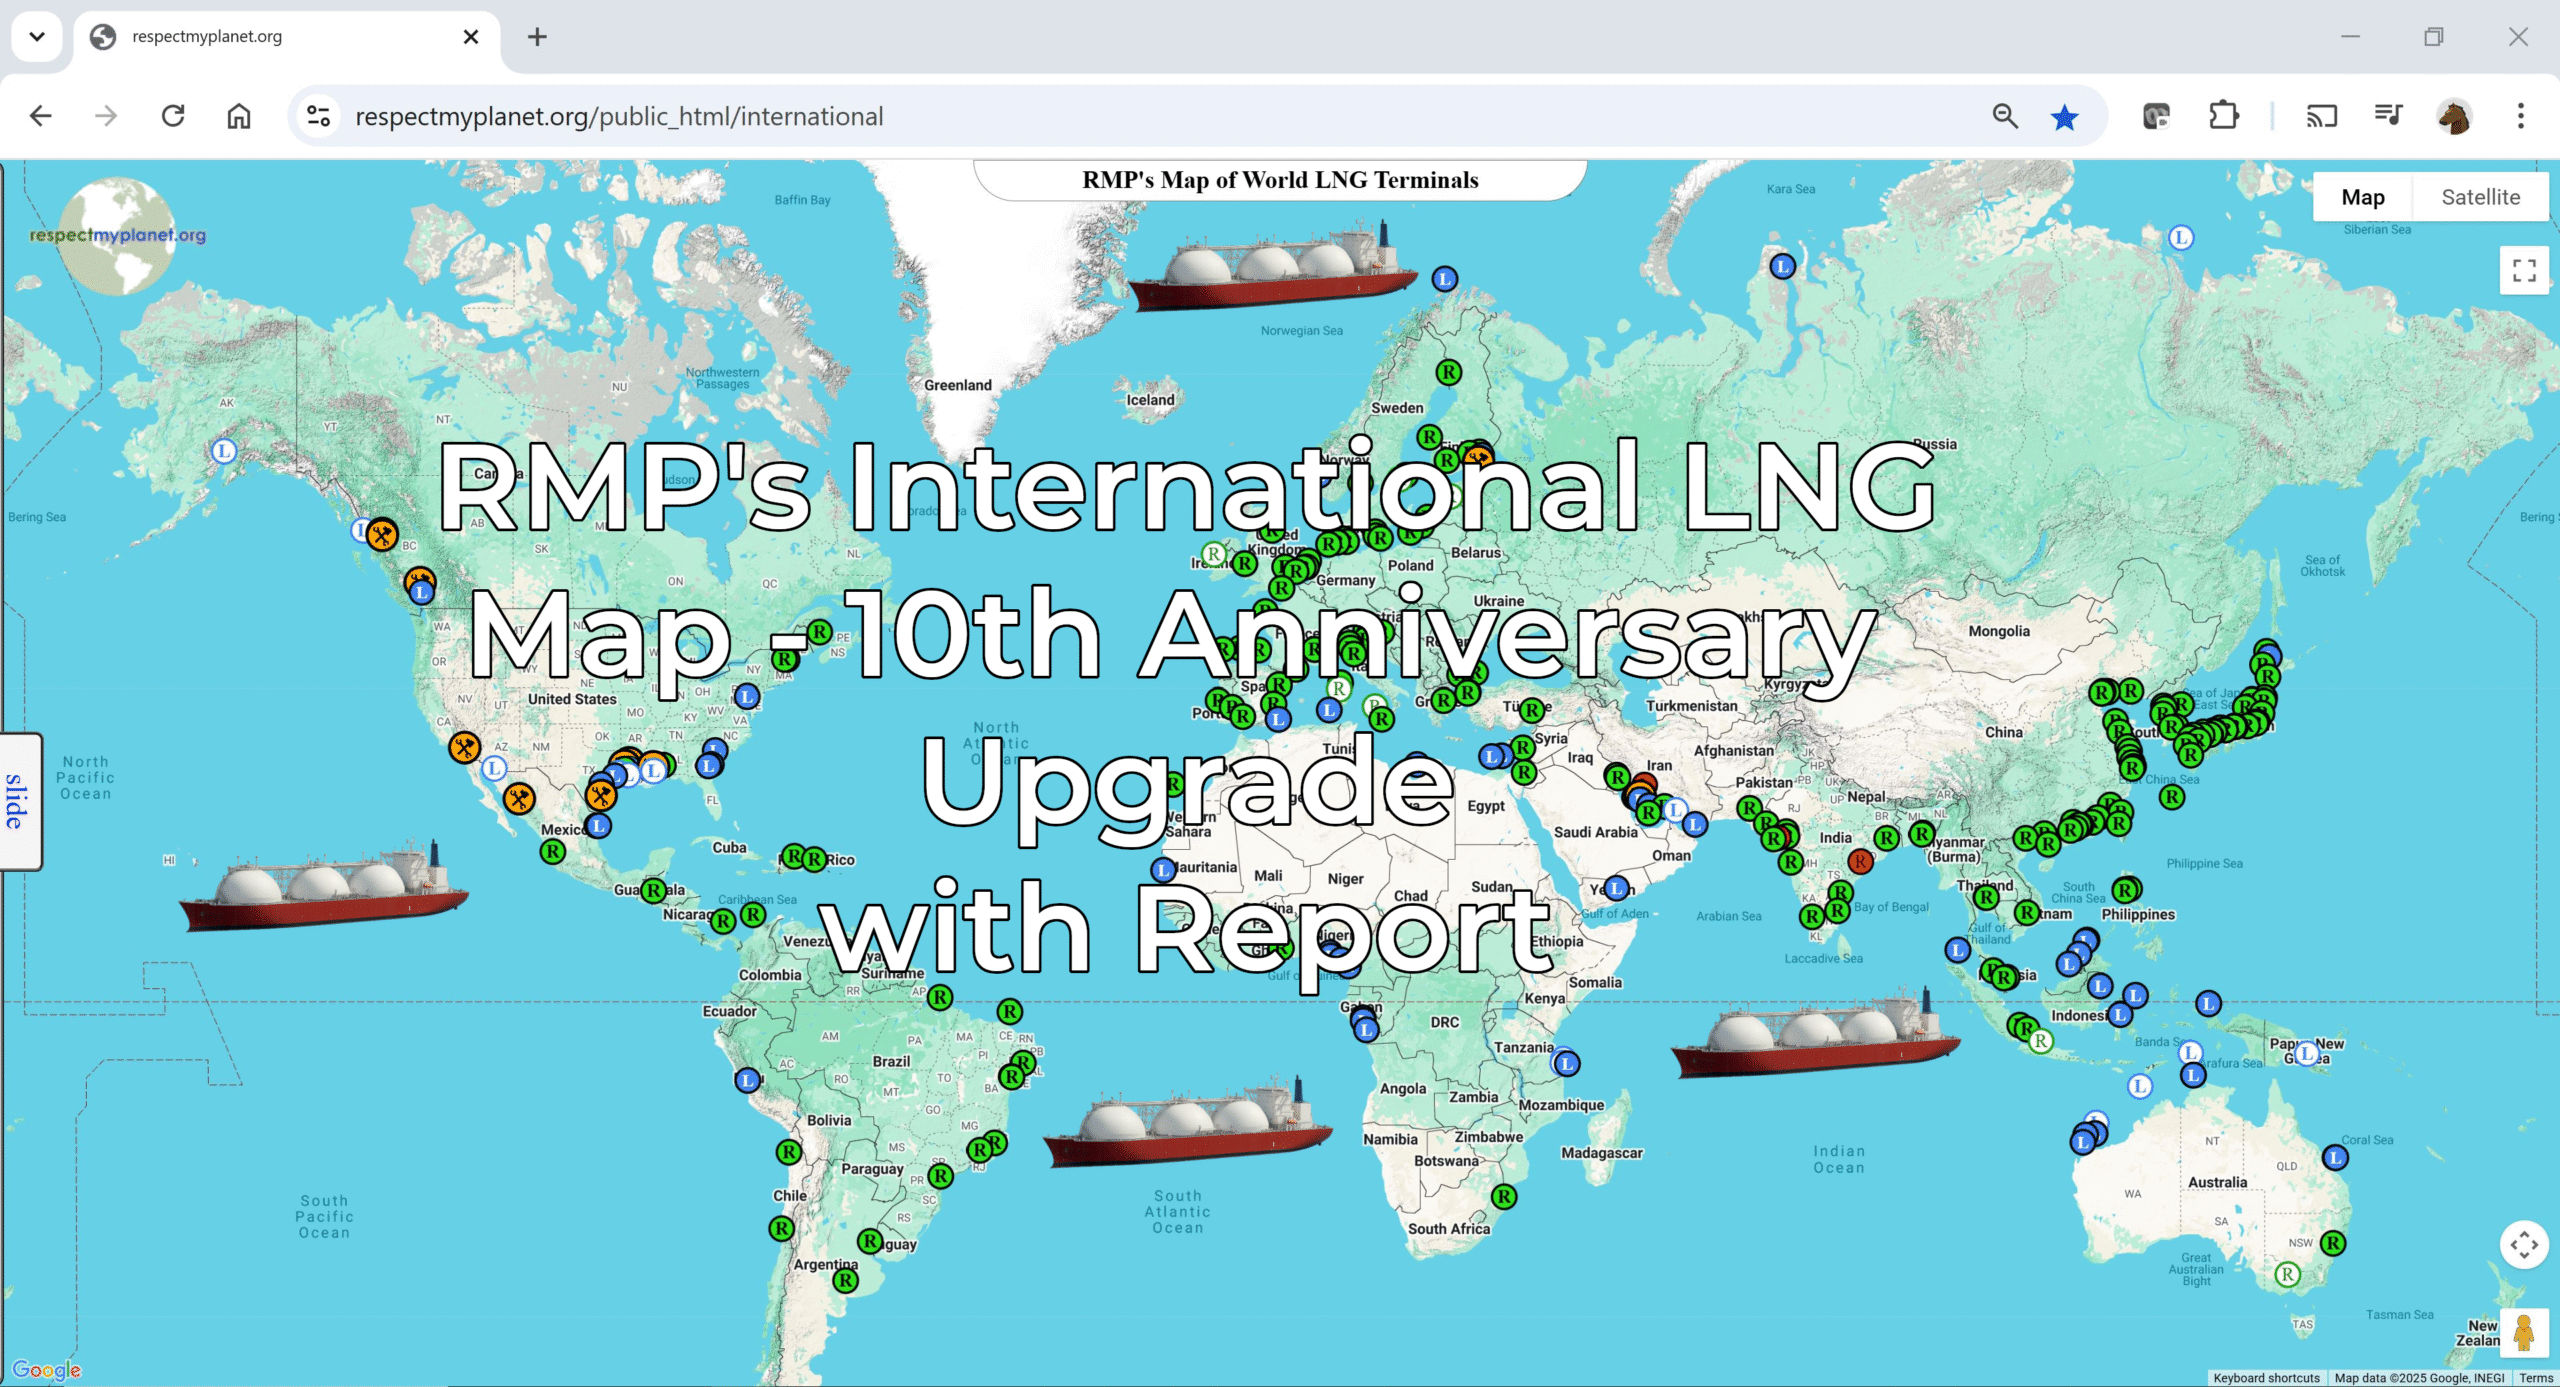
Explore RMP’s Interactive Global LNG Terminal Map & discover where the next gas projects are taking shape around the world.
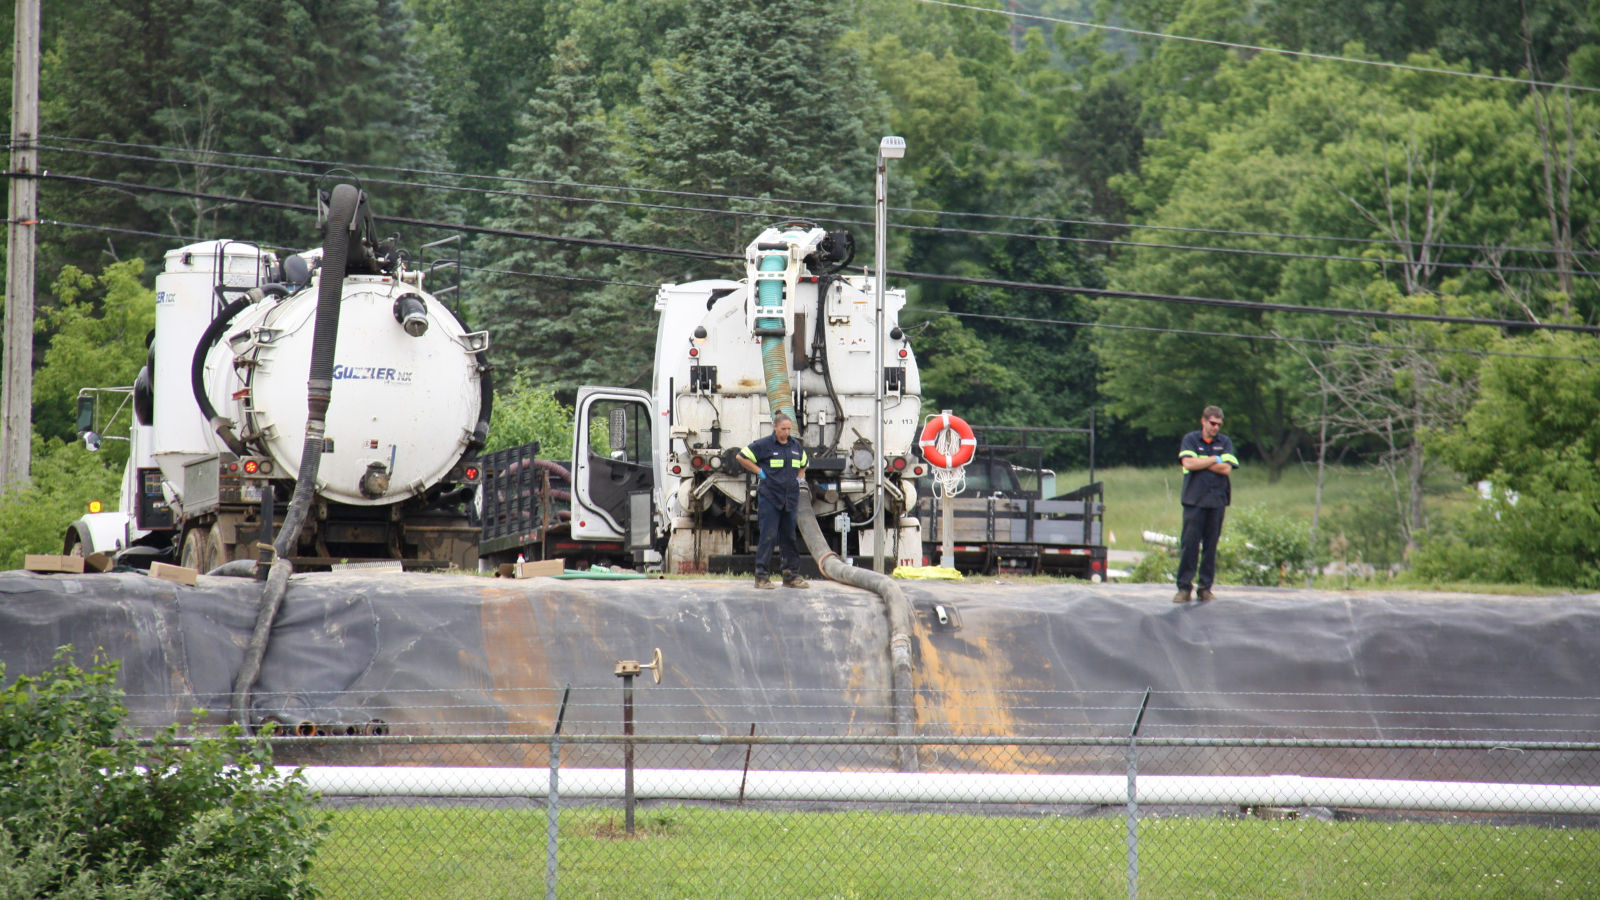
Read RMP’s in-depth coverage of Ann Arbor’s 1,4-Dioxane plume and explore our detailed interactive cleanup map.
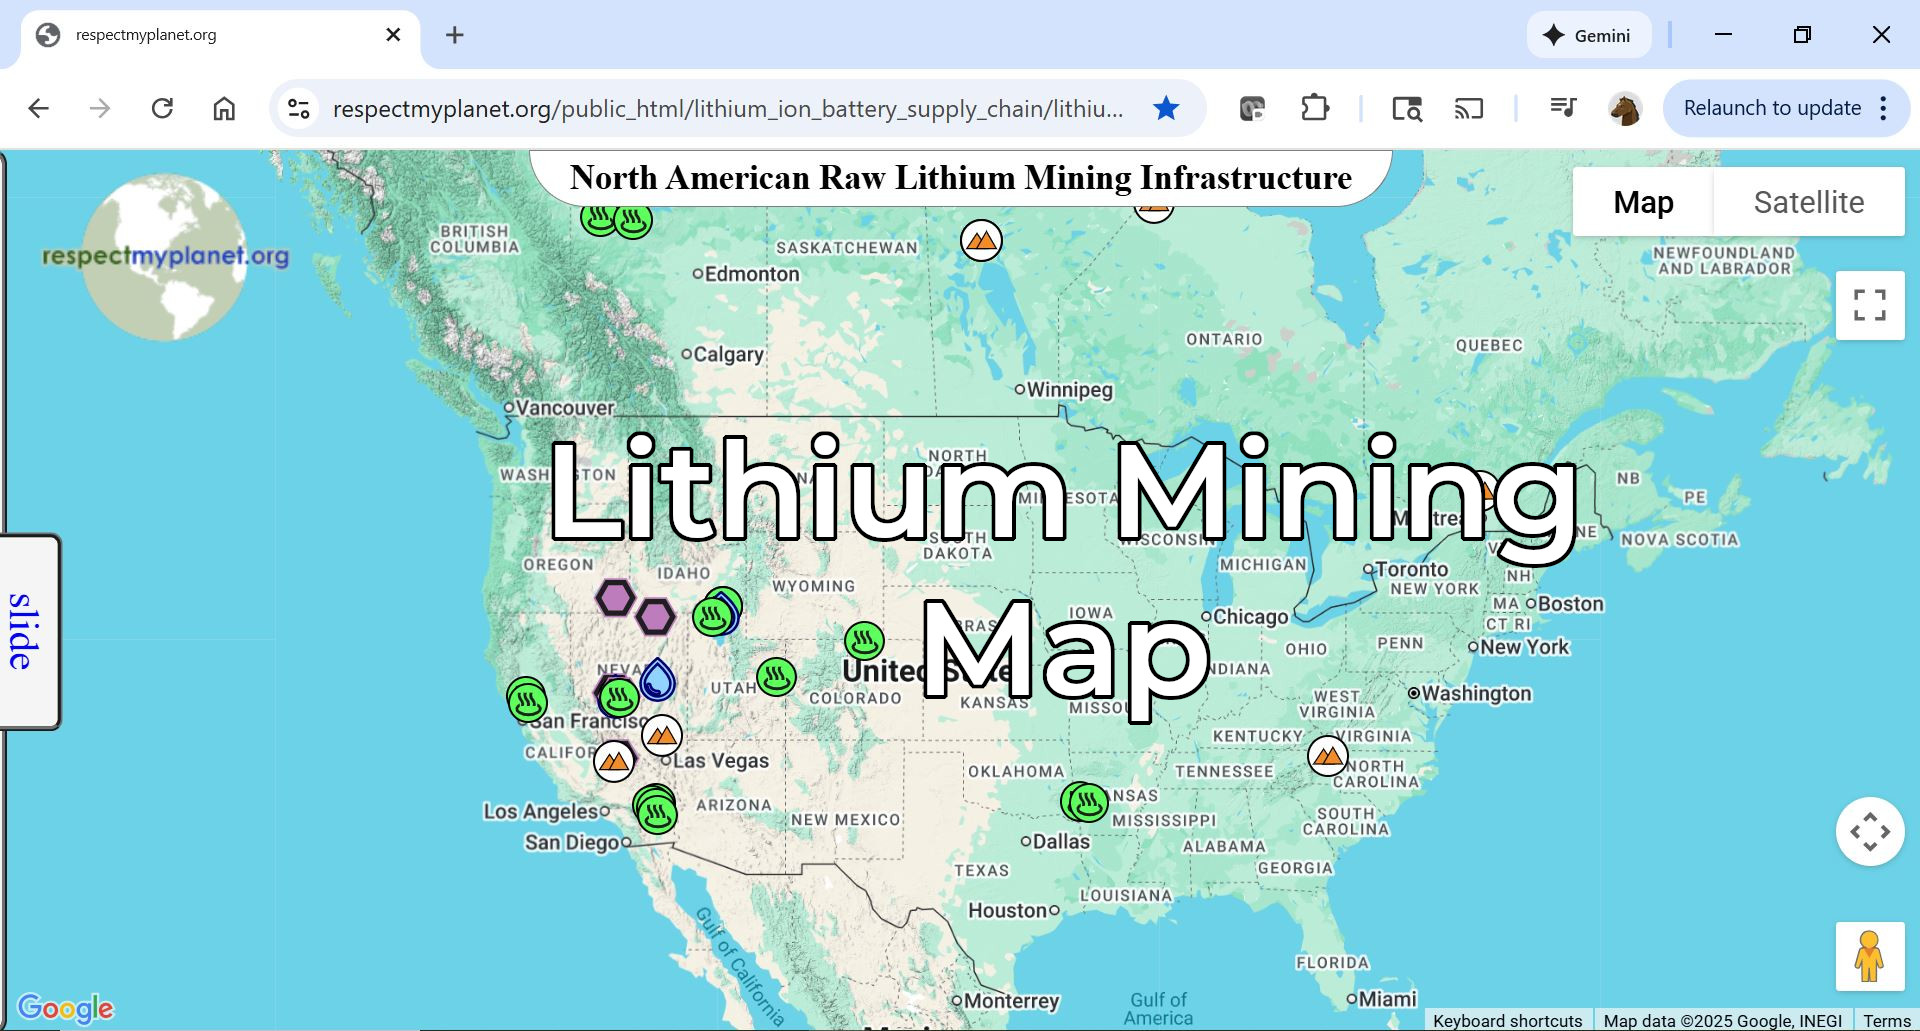
Explore RMP’s interactive NAATBatt and U.S. Copper Mine map tracking North America’s battery manufacturing full supply chain.
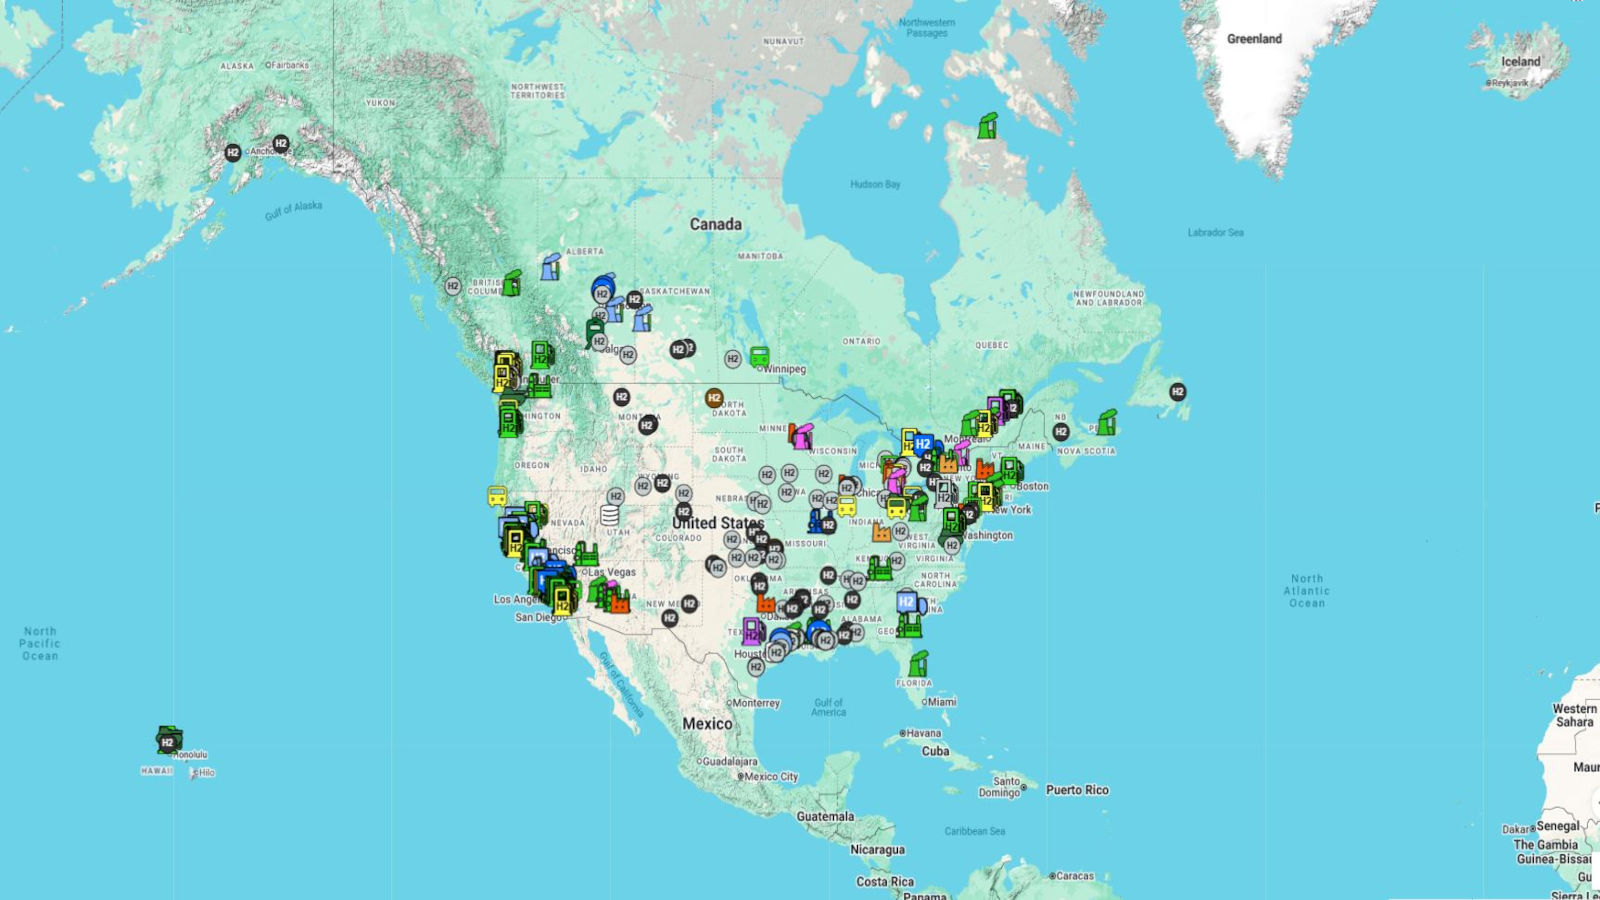
RMP is tracking current & planned hydrogen production in green, pink, blue, gray, and brown across North America.

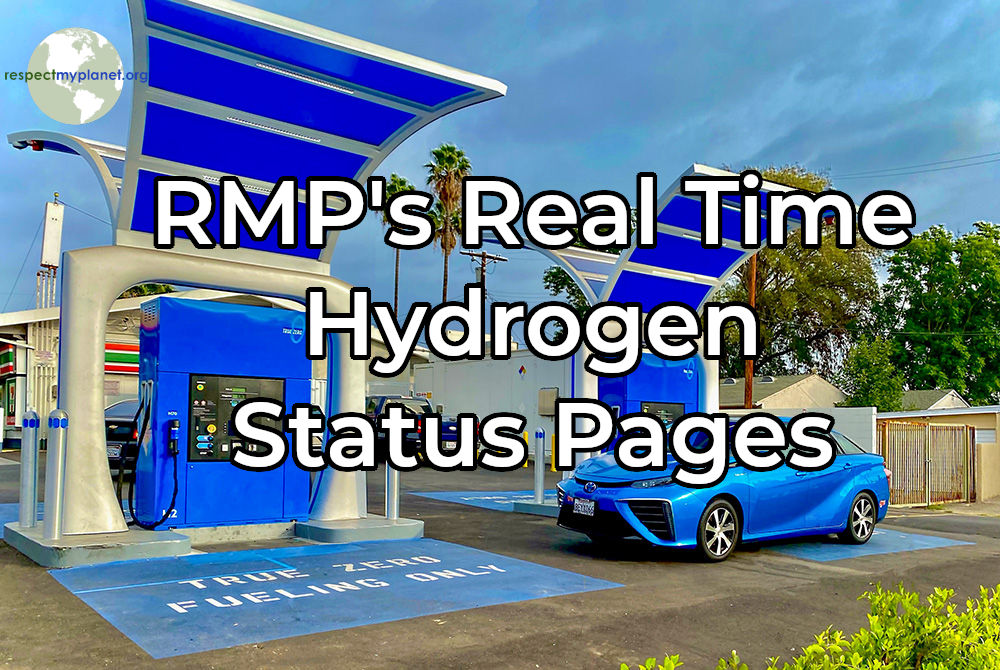
RMP is tracking the real time status of hydrogen refueling stations in California. Check before you go across the state.
Tracking the Infrastructure Powering the Energy Transition
Mapping the facilities shaping energy today from LNG and hydrogen to batteries and recycling. Real infrastructure, real data – mapped, tracked, and contextualized.
Latest News…
-
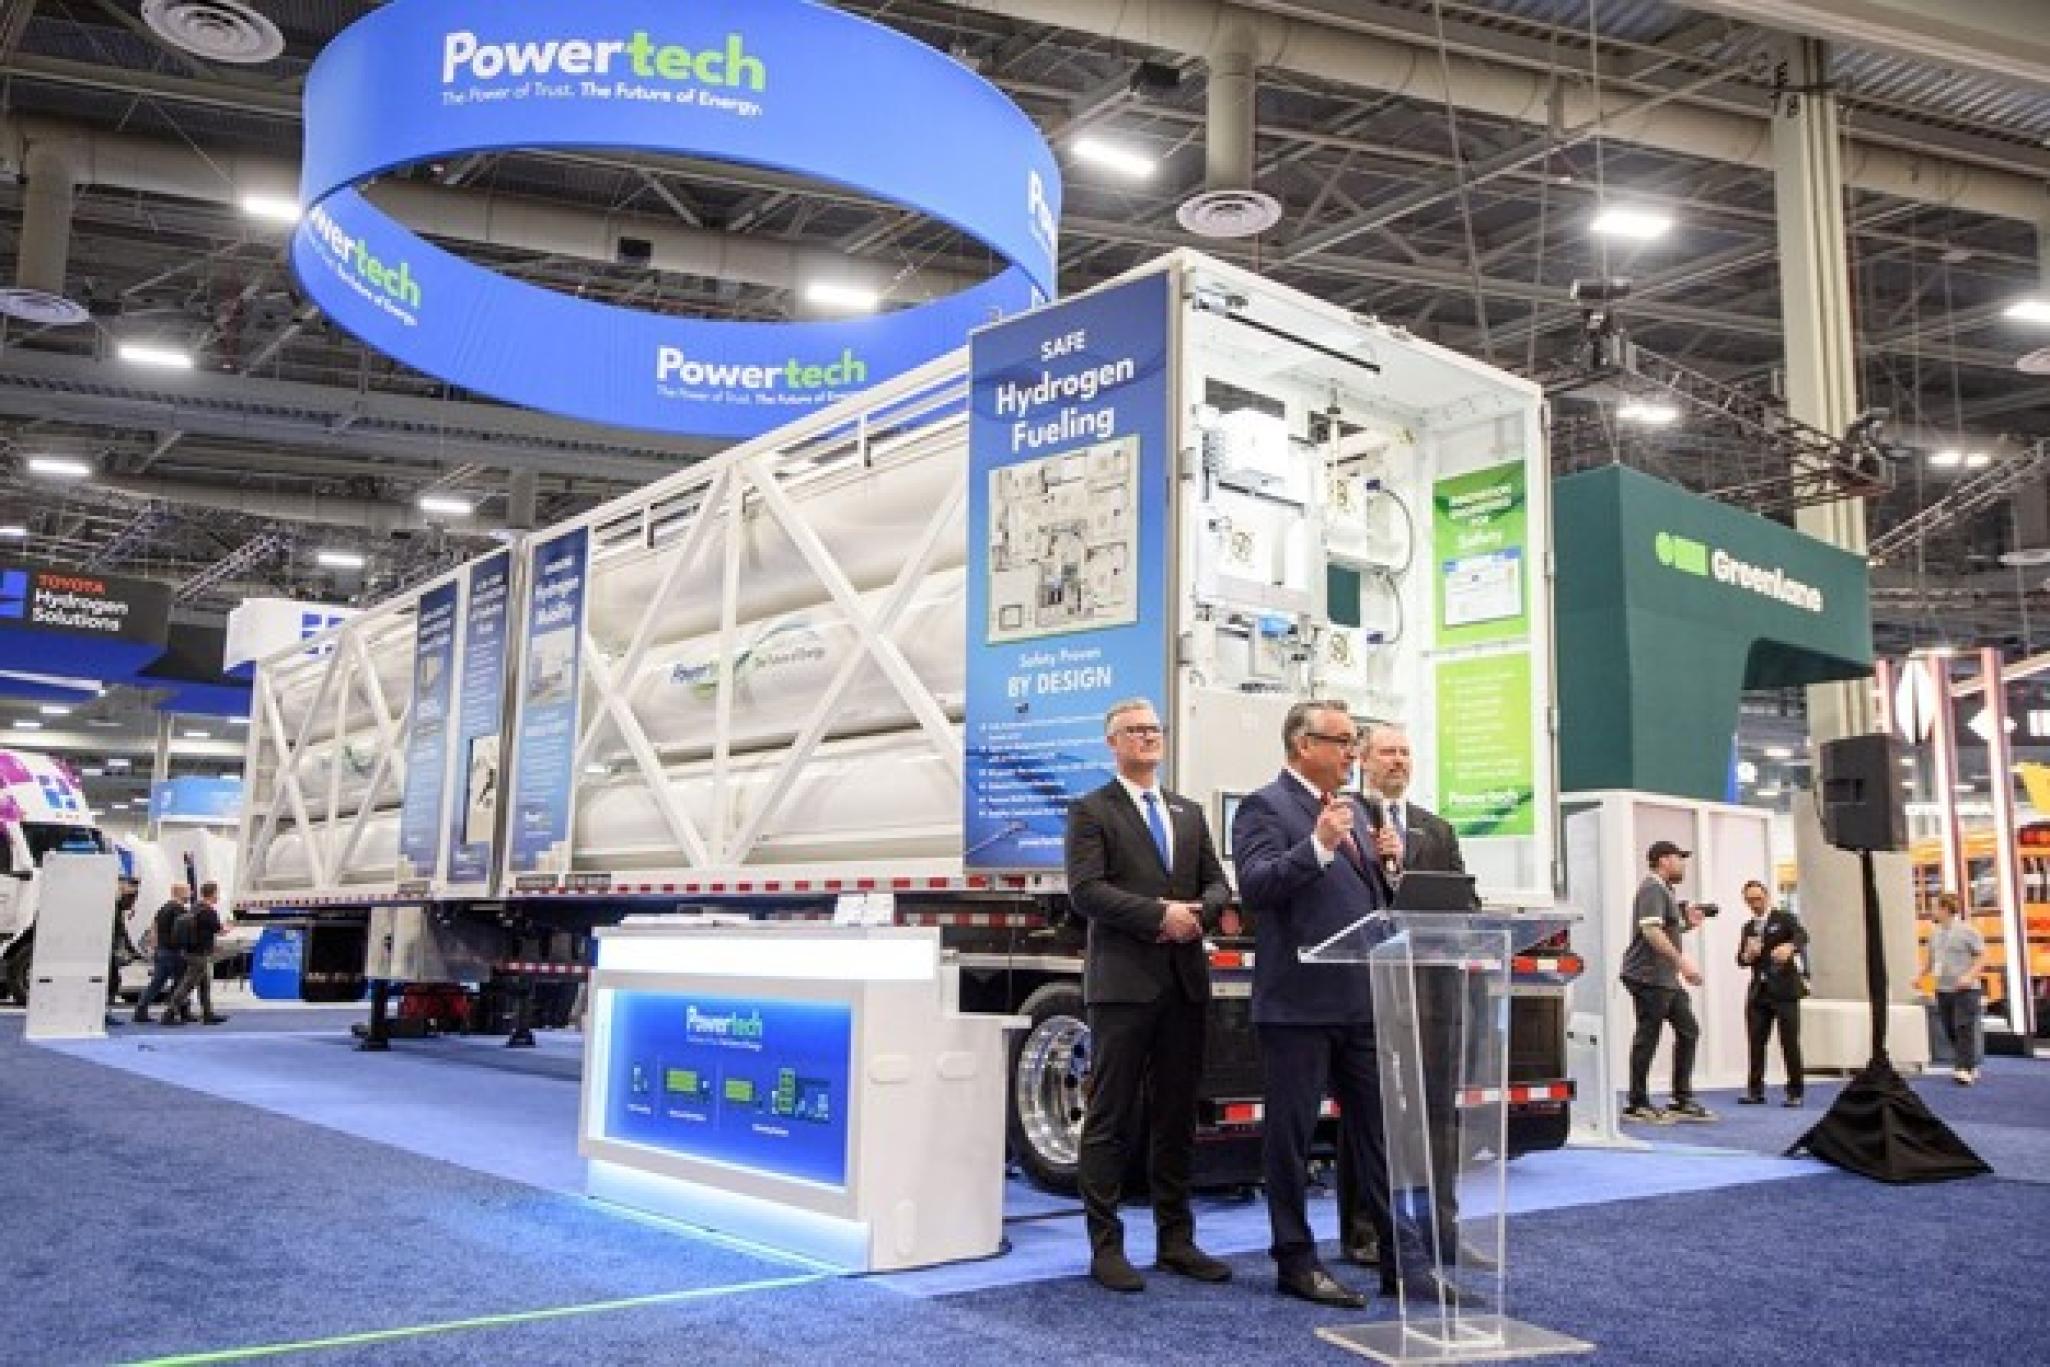
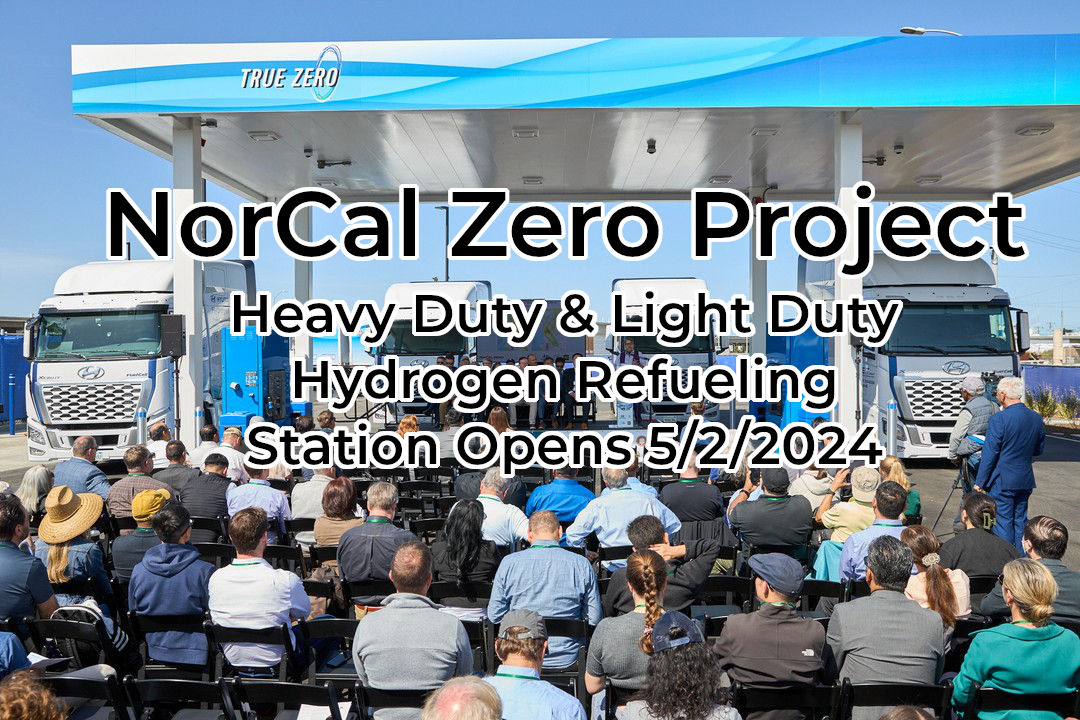
How Powertech’s New Hydrogen Trailer Could Strengthen Hydrogen Logistics
-
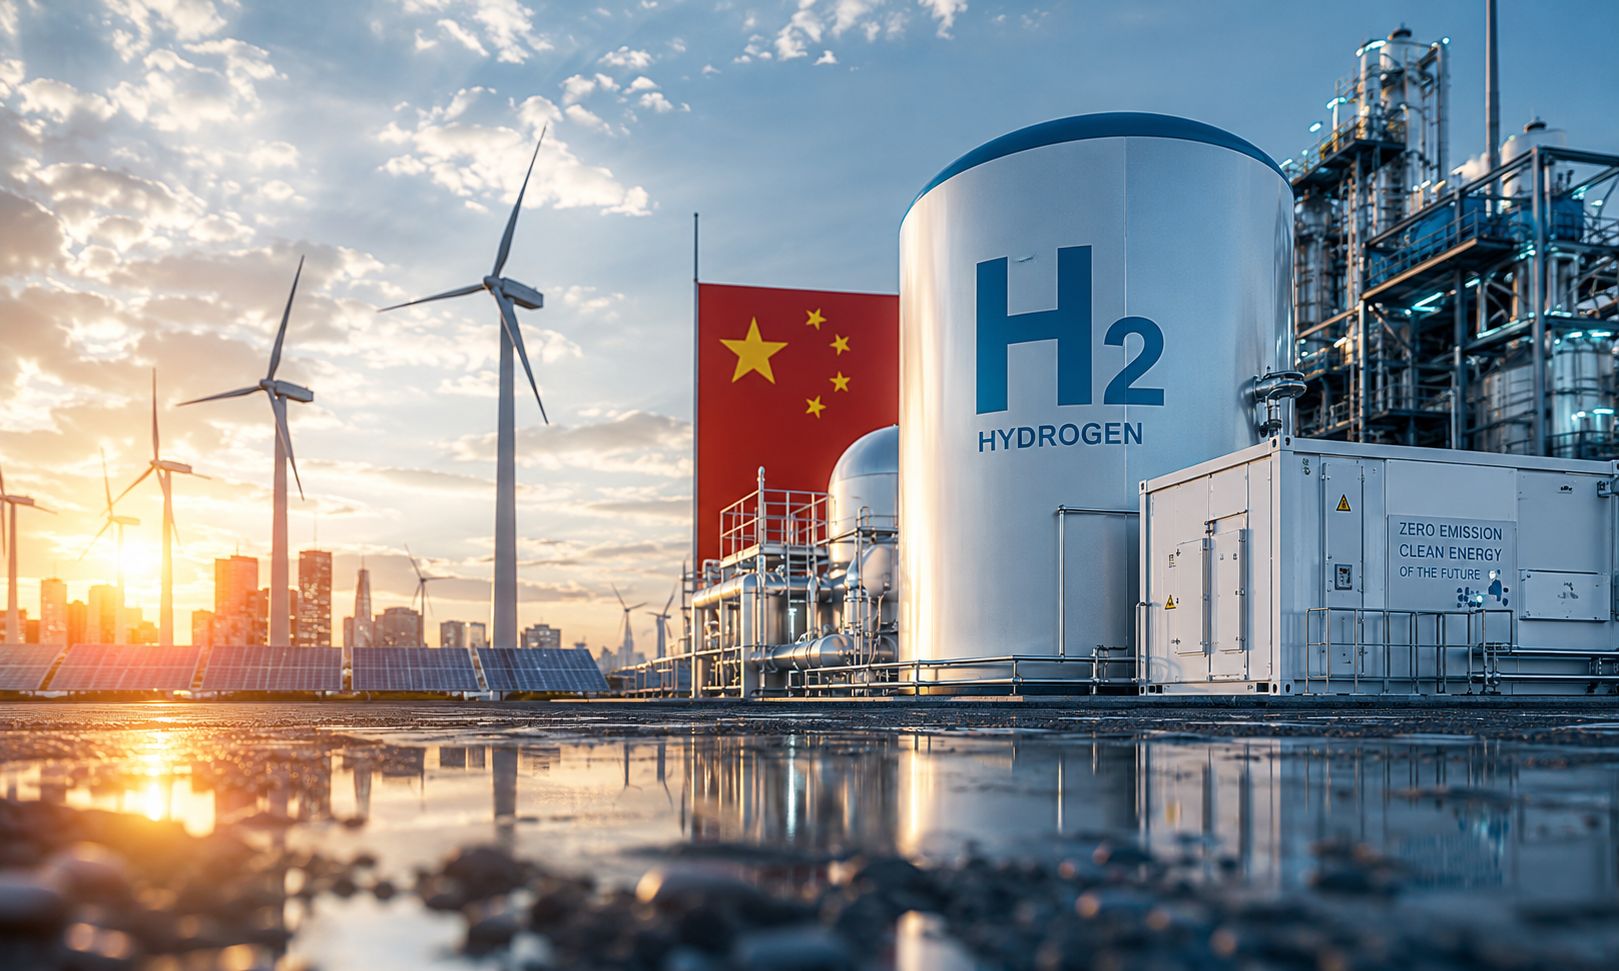
Hydrogen in China’s 15th Five-Year Plan: From Pilot Projects to National Strategy
-
The Billion-Dollar BEV Reality Check: GM Pauses Indiana Battery Plant as OEM Losses Mount
-
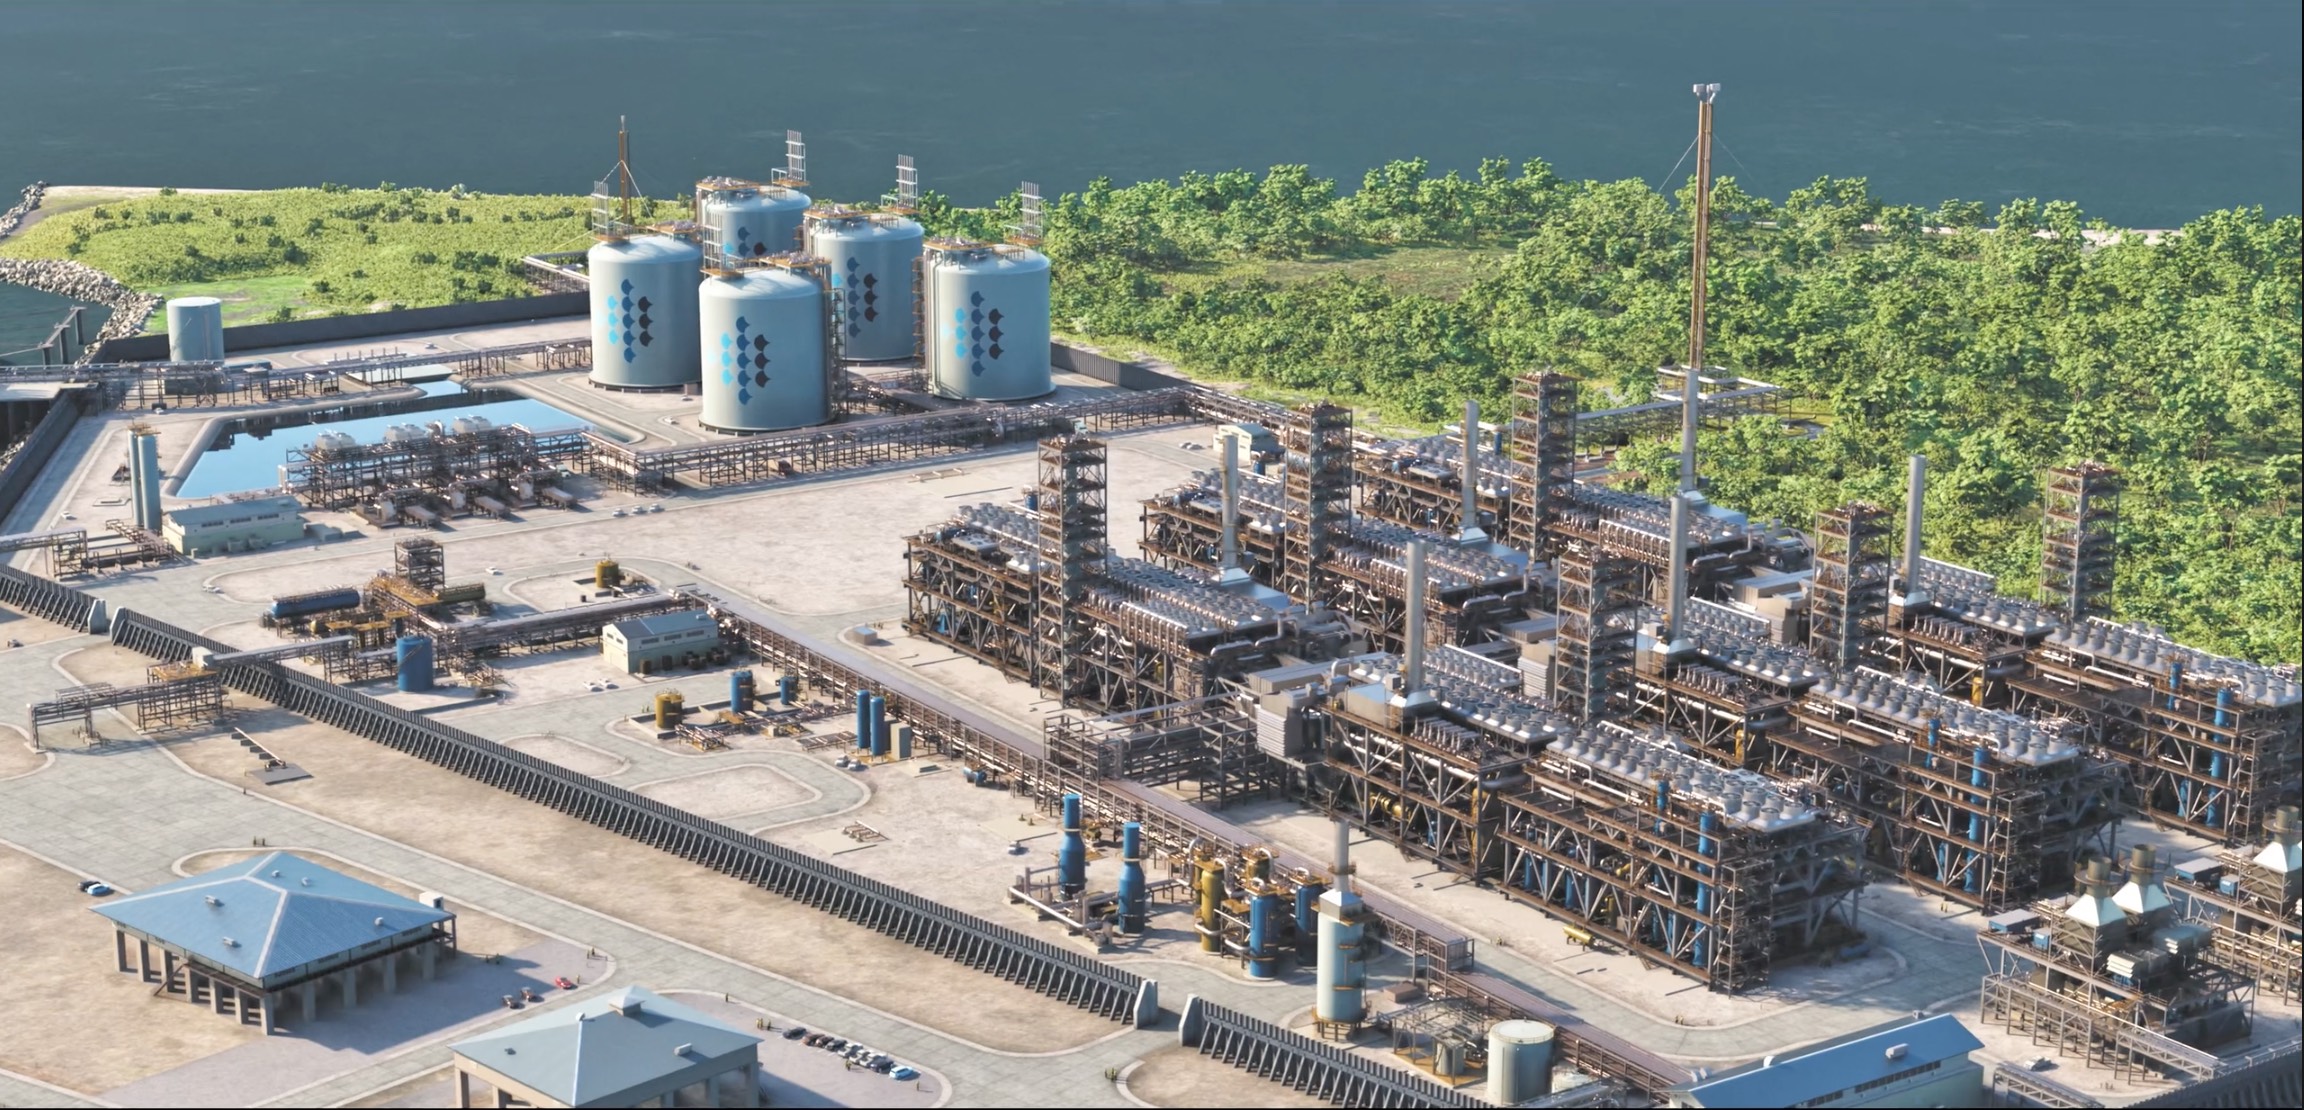
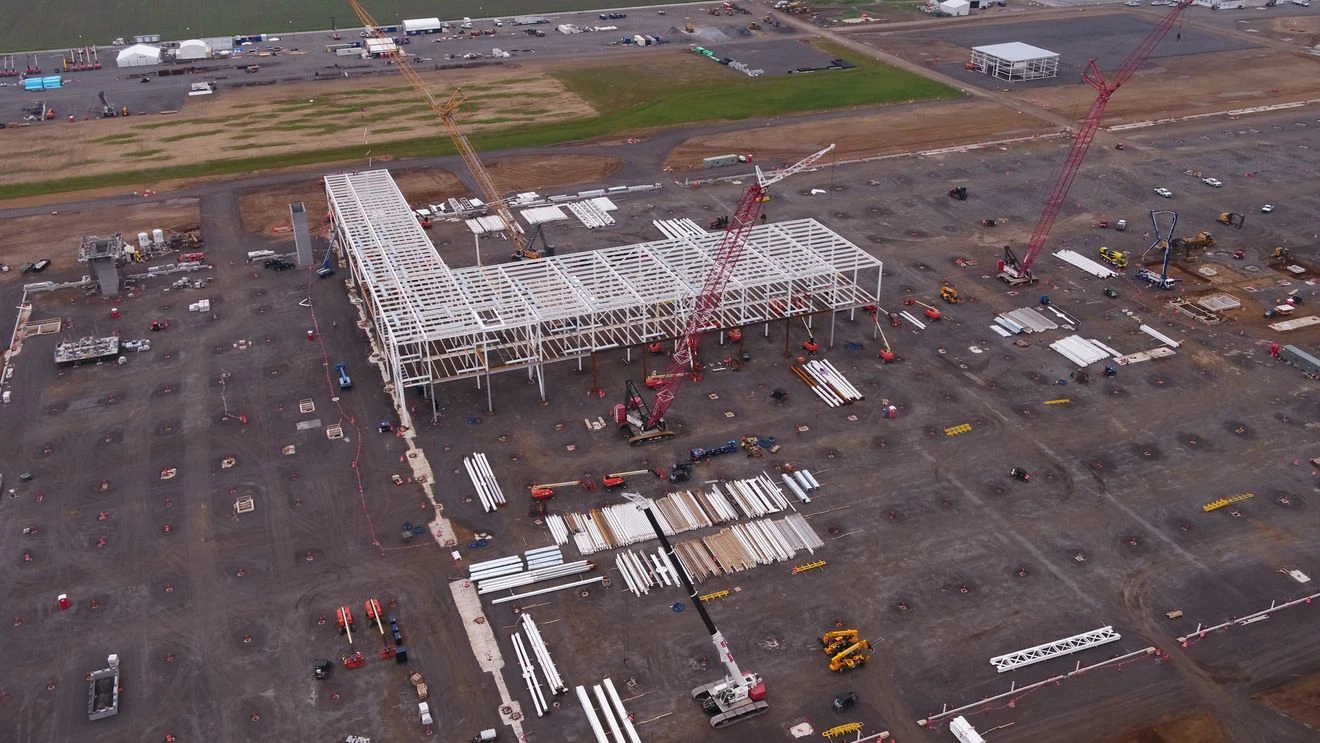
Commonwealth LNG Approves $13 Billion Louisiana Export Project Amid Gulf Coast LNG Boom

Tracking LNG Globally
We have 101 liquefaction & 201 regasification facilities in our detailed database

Sign up to get updates on energy infrastructure
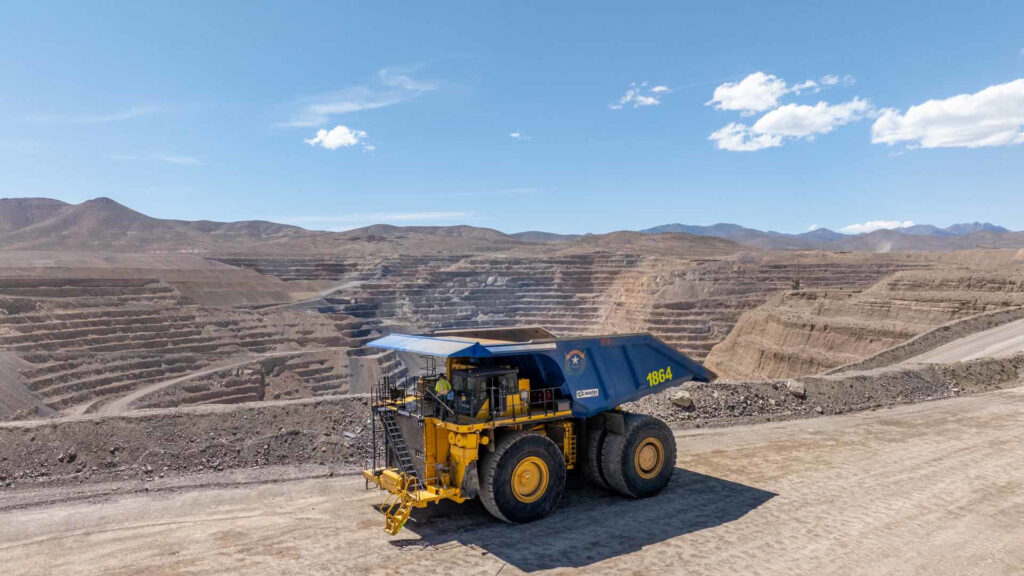
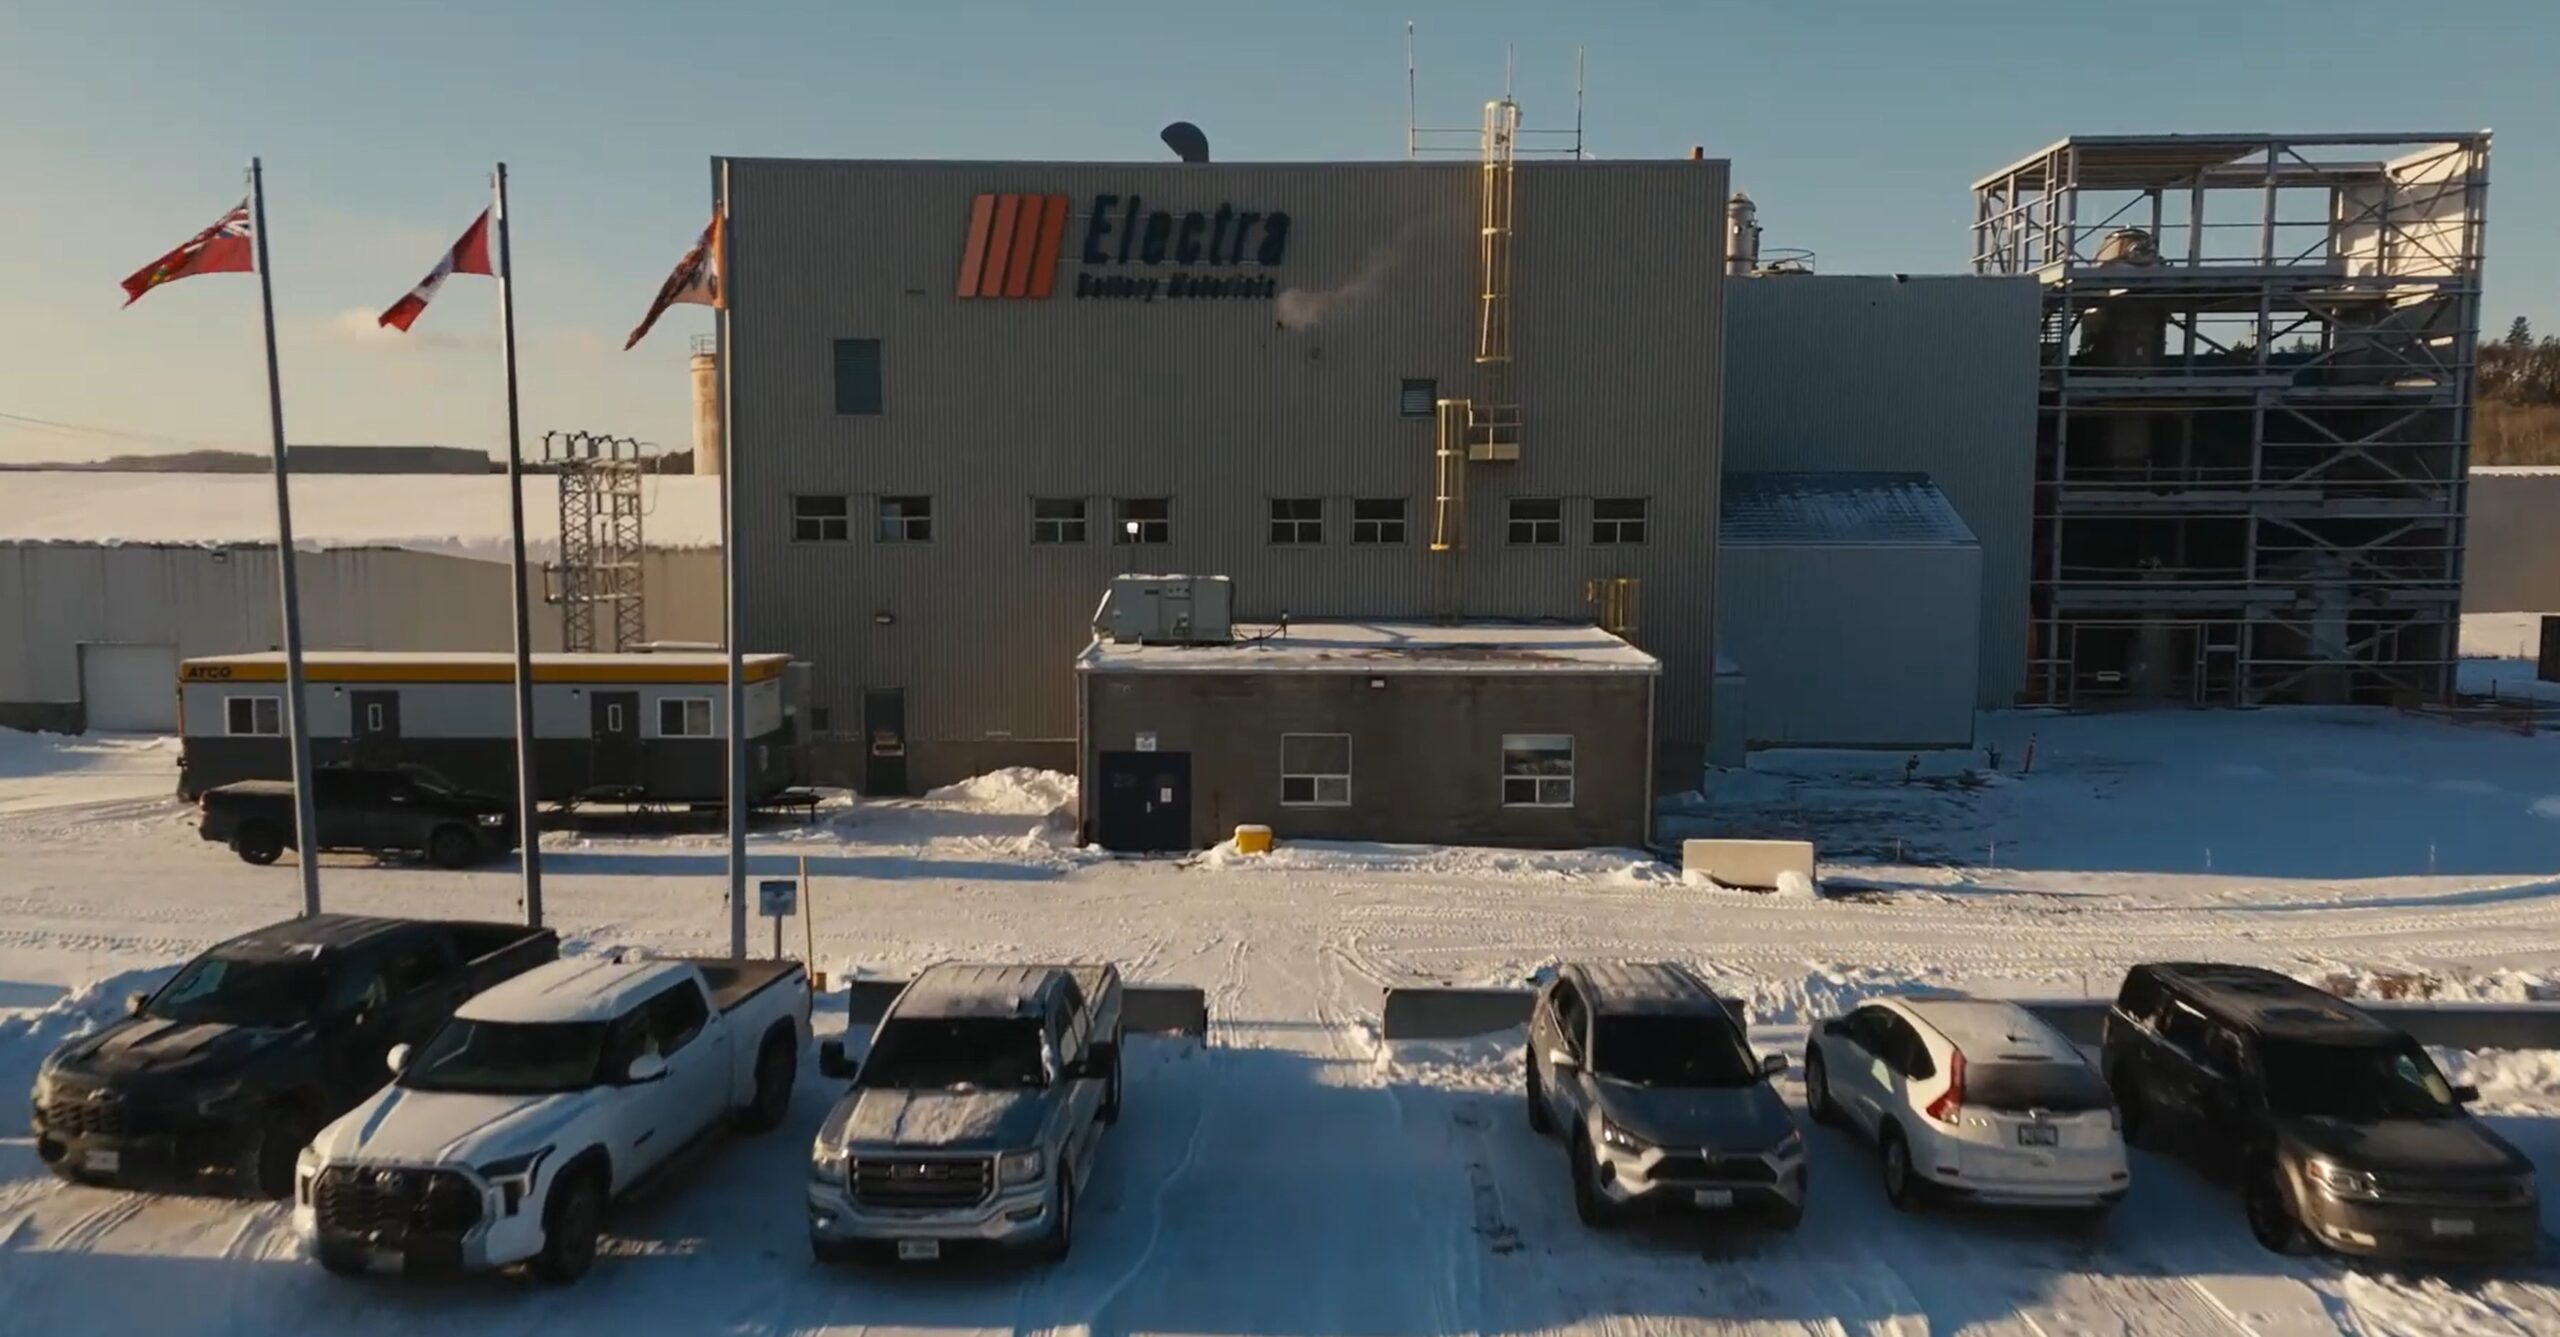
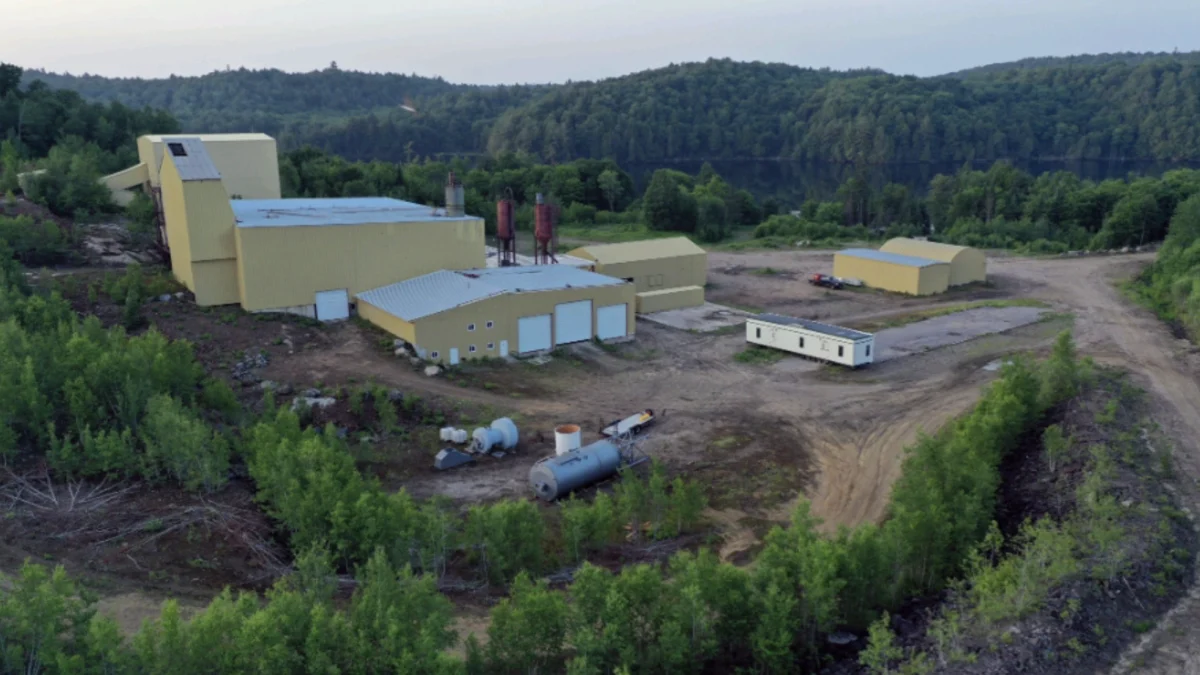
North America’s Lithium-ion Supply Chain
RMP’s NAATBatt database map tracks America’s battery market from mining & refining to cell & pack manufacturing

Read RMP’s Popular Research Analysis Debunking Michael Liebreich’s Hydrogen Ladder
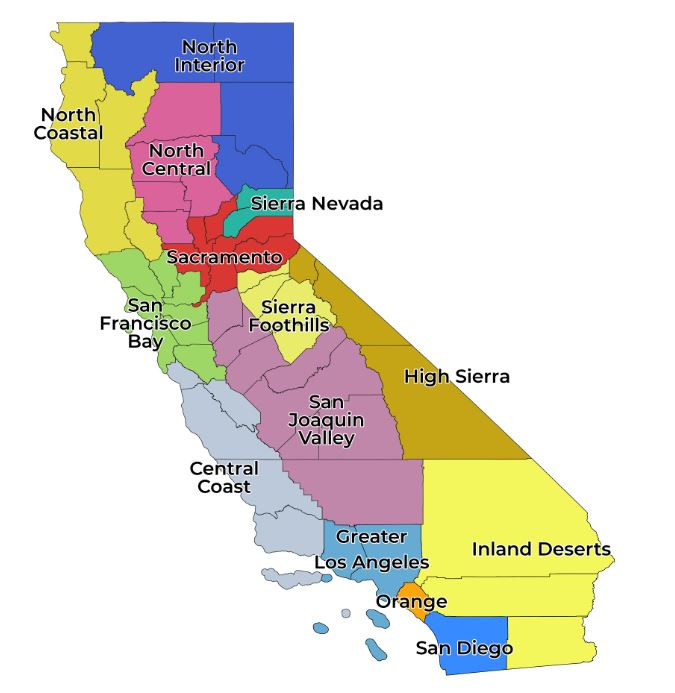
Check the real-time status of every hydrogen refueling station in California. Click on any region and any station to see its status and inventory in kilograms.
North America’s Hydrogen Database
RMP is tracking over 400 hydrogen refueling, production, and storage locations. Our comprehensive database includes fuel cell manfac locations, H2 for oil refineries, and H2 for ammonia production