RMP is 501(c)3 non-profit organization registered in Michigan. We are committed to protecting fresh water resources by advocating for: sustainable energy production, hydrogen fuel cell vehicles, remediating environmental pollution & rethinking waste management.
Did you know RMP was the first Michigan organization to publish an interactive map of the Gelman 1,4 Dioxane Plume? RMP remains the only non-profit 501(c)3 organization in Michigan to offer a free interactive map of the Gelman 1,4 Dioxane Plume. RMP published the 1st interactive Google Map of all locations in the Pall Science Access DB in May of 2016, just over 8 years ago. About three years later and five years ago now, RMP published our 2nd generation Gelman 1,4 Dixoane Map. Today, we are officially launching our 3rd generation map. This is our most sophisticated and feature rich map yet.
While none of RMP’s maps are ever complete, this release marks a milestone for RMP’s version of the Gelman Map and our software as a whole. This map not only demonstrates a comprehensive coverage of all the most important features of the Ann Arbor Dioxane 1,4 Plume, it’s demonstrates a maturity in RMP’s mapping software. RMP can now use our software to more easily map other locations in Michigan. We can prototype a map more quickly with all of the same powerful tools used for this map.
What Constitutes A Good Environmental Remediation Map?
RMP’s mapping software consists of three basic features: points, polylines, and polygons. Points can be oil wells, water monitoring wells, residential wells, extraction wells or anything really. They’re represented by a single latitude & longitude pair on a Google Map. Polylines are Continue reading “RMP’s 3rd Generation Gelman 1,4 Dioxane Plume Map”
It is a milestone day for hydrogen refueling. The Center for Transportation and the Environment announces the inauguration of the NorCAL ZERO project. This new station can serve up to 200 Class 8 heavy duty trucks per day. It has a capacity of 4,000 kilograms of LH2. The station also can refuel class 1 vehicles and comes equipped with 4 light duty hoses for cars & SUVs. The $53 million collaborative effort will help deploy 30 Hyundai Xcient Class 8 hydrogen fuel cell trucks. These big rigs are the world’s first mass produced Class 8 fuel cell trucks.
West Oakland, a historically Black and Latino community, faces outsized environmental burdens from heavy industry, freeways, and diesel trucks coming to and from the Port of Oakland. CTE projects that the NorCAL ZERO project has the potential to avoid the equivalent to 2,393,124 gallons of diesel burned. Burning diesel releases NOx pollution which impacts the air people breathe and is especially burdensome near a large port like the Port of Oakland where many class 8 diesel trucks gather. Each diesel truck replaced with a zero emission hydrogen fuel cell truck will Continue reading “NorCal Zero Project”
RMP has upgraded our California hydrogen maps by including a new map for real time station status and a new map for stations coming soon. All stations reporting SOSS status in California are summarized on our landing page at this link and shown below (Figure 1 ). All of the pages covered in this post and associated maps are optimized for mobile devices so drivers in California can use them to find the nearest station and its current status easily on their phones. But, the pages are also designed to work well on a desktop computer where it’s a little more fun to analyze the maps on your big screen at home if you want to dig deeper into data analytics.
California Summary Page:
At the time of this writing there are 56 stations open to the public for retail sale of H2 in California and they all report their status via H2FCP.org’s SOSS server. There are several more stations in various stations of development that will eventually come online and be open for retail business. When the commissioning of a new station is complete and it comes online, it will report its first SOSS status and be added to the table by county/region. RMP summarizes all stations by county and region. RMP has divided California’s 58 counties into 14 regions (Figure 2). Each region has at least one county (Orange county and San Diego county are both single county regions).
Scrolling down past the summary data table on the live page, you’ll see a graphic of California broken up into these 14 regions (Figure 2 ). Only regions with open stations or stations coming soon are shown in the data table, but all regions are shown in the graphic. Within each region, you can see this boundary lines of each county within that region.
RMP’s landing page shows a table of the real time status tallies of all stations in California by region. You can see how many stations are online now, how many have limited availability now, how many are offline now, or have some other status. The SOSS server reports one of six statuses for any given station:
1 = Online (Green Circle)
2 = Limited Availability (Yellow Triangle)
3 = Offline (Red Square)
4 = Unknown (Gray Triangle – “Other” on main page)
5 = Closed (Gray Square – “Other on main page”)
6 = Refresh (Blue Square – “Other” on main page)
From the main landing page, you can see the overview of the whole state and each region and you can drill down on more detail for each region. You can click on the SOSS MAP to see all the retail stations on a Google Map, you can click on the COMING SOON MAP to see all stations in development, or you can click on any region to see a detailed listing of all stations, their current status, and their current inventory in kilograms. If you click on California, you will see a detailed listing of all stations in California and their associated status & inventory in kgs. The last updated time is always stamped at the top of the page in Pacific Standard Time (PST). RMP pings the SOSS server once every 15 minutes on the quarter hour and takes a snapshot of all station statuses. Therefore, the statuses you see are always no more than 15 minutes old when you load the page.
Regional Listing Page:
When you click on any region from the main page, you’ll launch a regional page and see a detailed listing of all stations in that region as well as their associated status & inventory level (Figure 3). At the very top of the regional page you will again see the SOSS MAP link and the COMING SOON MAP along with the additional SHOW GRAPHS link. When you first load the regional page, the graphs are hidden. If you click the SHOW GRAPHS link, you will see a graph of the last 24 hours of station status & inventory. Each graph shows the station’s status & inventory in 96 different bars representing 15 minute increments over the past 24 hours. The height of the bar represents the inventory level in kg and the color of the bar represents the status at the time the status was read from the SOSS server; same color coding as described above for each of the six different statuses. If you’re using a desktop computer, you can hold your mouse over the graph to see the time stamp and inventory level in more detail, if you’re on your phone or an iPad, lightly drag your fingertip across the graph to see the same.
Again, the timestamp of the data you’re seeing on the regional page is always shown at the top of the page to let you know the time the status snapshot was taken. All stations in the region are listed corresponding to the count tallies you saw on the summary page. If you see an “i” icon next to the station’s name, it indicates the station has a special information message being broadcast from the SOSS server. You can click on any station to go to that station’s homepage where you can find additional details about the station including the information message. Below the table of stations listed on the regional page is an infographic showing the counties included in that region (Figure 4).
Station Homepage:
The station homepage has additional station details for each specific location. If the station was marked with an “i” icon on the regional page, you will be able to see the information message on the station homepage in a yellow info box just below the station title (Figure 5). Along with the status and inventory message, you will also find additional station information like address and phone number. The graph on the home page is similar to the graph on the regional page but shows activity over the past 3 days in 45 minute increments to show a longer horizon. You can also see the 5 closest stations and their status. You can also see the 5 closest stations coming soon (not pictured).
In Conclusion:
RMP is now hosting three basic real time pages: a California summary page, a regional page for each region, and a location homepage for each refueling station. Please check them out and make a bookmark if you like it. As always, check with H2FCP.org for official information.
The official URL for RMP’s Real Time Hydrogen Status landing page is:
Michael Liebreich is an outspoken critic of hydrogen for transportation & energy solutions. Michael purports to be an objective resource on energy information but he is a ground floor investor in ChargePoint which presents a conflict of interest to his objectivity. ChargePoint bills itself as the world’s leading EV charging network and says they focus on their “commitment to EV charging—and only EV charging”.[1] Michael says we must choose only one solution for entire market segments like energy & transportation; and he says hydrogen cannot compete economically in those segments. Michael has fabricated a narrative he calls the Hydrogen Ladder to support his investments and sow doubt about hydrogen. Michael specifically and aggressively tries to discourage sovereign investments directed toward hydrogen through Twitter, YouTube, and other platforms. Michael uses his bully pulpit to try to kill off hydrogen ambitions he perceives as threats to his personal investments with information that misleads the public.
RMP has largely ignored Michael Liebreich over the past few years as one more blustery voice among many that would use their platform to smear hydrogen’s economic potential. I decided to post this article on RMP to debunk Michael’s Hydrogen Ladder after he was invited to give the keynote speech at the October 2022 World Hydrogen Congress in Rotterdam. It is important to speak up and speak out against information that misleads the public and does not serve the best interest of our economy and our environment. Just like RMP has debunked false narratives spun to smear hydrogen from Dr. Ulf Bossel & Mark Jacobson, RMP will now debunk Michael Liebreich’s Hydrogen Ladder.
Introduction
RMP follows the energy sector of our economy closely and has a history as an environmental watchdog organization. The org was formed when HVHF oil companies came to Michigan in 2008 to produce small amounts of natural gas & oil using record amounts of our fresh water resources. RMP seeks to expose human avarice that threatens our fresh water public natural resources for private profits when headlines don’t jive with the underlying data. RMP’s core mission is to protect our fresh water natural resources. RMP has been successful exposing threats to our environment because of our focus on how energy operations work in the real world and how those operations generate profits & losses using our natural resources. RMP uses a simple formula at the heart of our research: follow the money.
RMP has gathered a wealth of energy infrastructure data in a relational database over the past 14 years that allows insight into how legislators and decision makers use our natural resources. RMP uses this relational database of energy infrastructure to debunk or corroborate claims made in the news or on social media by people like Michael Liebreich. Because RMP has one of the most (if not the most) comprehensive public & free to use databases of hydrogen infrastructure in North America, RMP is particularly well suited to debunk false claims about hydrogen fuel cells & hydrogen infrastructure. In this post, RMP will apply our Continue reading “Michael Liebreich’s Hydrogen Ladder Debunked”
The false narrative about hydrogen for FCEVs is officially dead. Air Liquide opened their North Las Vegas renewable hydrogen liquefaction plant this month to provide green hydrogen to California FCEV drivers. Air Liquide’s $250 million investment is purpose built to supply green hydrogen to the California FCEV market for both cars & big class 8 trucks. The plant will Continue reading “Hydrogen for FCEVs Nearly 100% Green While BEVs Use >80% Non-Renewable Energy”
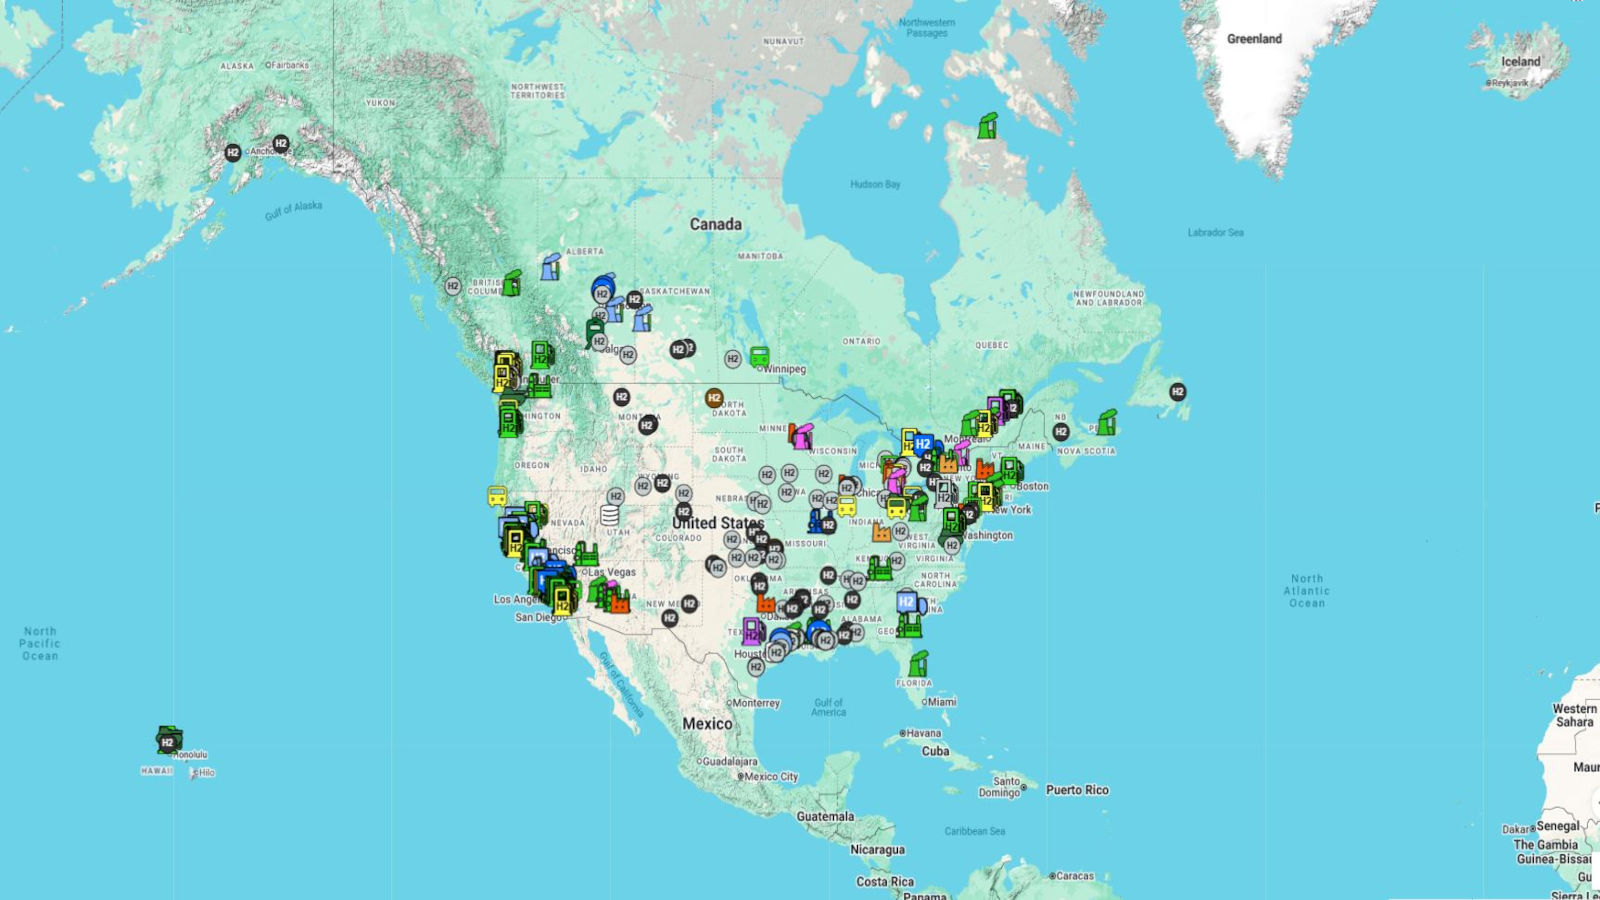
This quarterly report chronicles key H2 infrastructure developments & stories from the past three months and is published on the last day of the quarter. Each key news item will be highlighted with a synopsis of the key event, a link to the story, and a link to its location on RMP’s Google map of hydrogen infrastructure across the USA & Canada if applicable. Simply click the map link to go directly to a zoomed in map marker on RMP’s map of H2 infrastructure. The marker on the map will be used as a Continue reading “USA & CANADA QUARTERLY H2 INFRASTRUCTURE UPDATE 2022-Q1”
Battery technology has come a long way and has helped us in many ways. Hydrogen technology has also come a long way and shows promise to reduce carbon intensity in energy sectors that batteries cannot reach. Green hydrogen can reduce CO2 emissions in the manufacture of ammonia, steel, and concrete as well as many other products. Hydrogen acceptance and enthusiasm could be much further along than it is today, but it has been held back by Continue reading “Top Four Hydrogen Myths”
This quarterly report chronicles key H2 infrastructure developments & stories from the past three months and is published on the last day of the quarter. Each key news item will be highlighted with a synopsis of the key event, a link to the story, and a link to its location on RMP’s Google map of hydrogen infrastructure across the USA & Canada if applicable. Simply click the map link to go directly to a zoomed in map marker on RMP’s map of H2 infrastructure. The marker on the map will be used as a virtual data repository for that specific location (like a Wiki page for that location). If you want to learn more about what’s going on at that location, you can go to its homepage to get all information available for that location.Continue reading “USA & CANADA QUARTERLY H2 INFRASTRUCTURE UPDATE 2021-Q4”
Blue hydrogen has been making headlines this summer. It’s made from natural gas in a two-part process called autothermal reformation (ATR). The ATR process is different than the steam reformation (SMR) process used to make most hydrogen over the past century. There has never been a market for hydrogen for energy so we learn more & more each year about how to Continue reading “The Truth About Blue Hydrogen”
Welcome new readers of RMP’s quarterly H2 infrastructure report. Each quarter we look back on the major stories related to hydrogen infrastructure advancements and we compare the current AFDC database to the AFDC database in the prior quarter to see what has changed. The AFDC database is updated by the US Dept of Energy & can be found by clicking here. RMP also keeps a supplemental data table of hydrogen production, liquefaction, rail and truck refueling stations. RMP adds our additional locations to the DOE’s database of Class 1 refueling locations to make a Continue reading “USA & CANADA QUARTERLY H2 INFRASTRUCTURE UPDATE 2021-Q3”