Introduction
In the early 2000s, the United States was bracing for a natural gas shortage. Domestic production was in decline, and forecasts predicted a growing dependence on foreign energy. Against this backdrop, Cheniere Energy began developing their Sabine Pass facility in Louisiana as an import terminal for liquefied natural gas (LNG). This project aimed to help the U.S. receive LNG from overseas to meet expected domestic shortfalls. The Federal Energy Regulatory Commission (FERC) initially licensed Cheniere as an LNG import facility, reflecting the broader energy consensus of the time: the U.S. was running out of economically recoverable gas.
However, the energy landscape was about to shift dramatically with the advent and rapid adoption of high-volume hydraulic fracturing (HVHF) combined with horizontal drilling. This technology was just hitting the scene around 2005 and energy insiders, as well as groups like RMP paying close attention, could see there was a paradigm shift coming in global energy markets. If you weren’t watching the oil majors closely, you might have missed it.
This HVHF technological breakthrough was unlocking vast reserves of natural gas trapped in shale formations across the country—especially in key plays like the Marcellus, Barnett, Haynesville, Permian, and Eagle Ford. As production soared, prices plummeted, and the United States transitioned from a presumed gas importer to a country with surplus supply. Recognizing this shift, Cheniere applied for and was granted a license by FERC in 2011 to convert its Sabine Pass facility into an export terminal, making it the first of its kind in the Lower 48. By 2016, when Cheniere began exporting LNG, the transformation was complete: in just a decade, the U.S. had gone from preparing to rely on global LNG markets to becoming an exporter on the world stage. Fast forward another 10 years to today, and the USA is the #1 LNG exporter in the world.
Natural Gas Boom Brings Oil Majors Back To Michigan
In parallel to this global shift in the energy landscape, RMP started following natural gas closely in 2008 when high-volume hydraulic fracturing came to Michigan. It’s how this organization was formed: we came together as volunteers to act as watchdogs for Michigan’s freshwater as major oil companies returned to our state armed with new drilling and completion techniques. Oil majors who had left Michigan in the 1980s were back to try drilling horizontally into new geologic formations that had never before been tapped in Michigan’s long oil and gas history. When companies like Halliburton and Schlumberger were contracted to frack Michigan’s Collingwood formation using up to 45 million gallons of water at a single location (Kalkaska, Michigan) for just two wells, RMP was born. We went on full alert to understand these new operations, recognizing that they were on a completely different scale than anything the state had seen before. A traditional Antrim gas well, like those fracked since 1952, typically used about 50,000 gallons of water for completion. To call these new wells “the same thing” was deeply misleading—it was like calling a mouse and a whale the same because they’re both mammals.
Trying to understand how oil & gas operations work became a passion and RMP has been collecting energy data ever since. RMP volunteers needed to understand the cradle to grave operations of oil & gas operators. We needed to know about surveying, drilling, completion techniques, flare testing, storage, distribution, you name it. These are the things a Michigan geologist working at the MDEQ had to know in order to understand how our water is protected. Therefore, we felt we needed to learn about these processes and we became amateur petroleum geologists through our efforts. All of us started reading about oil companies night & day and we accumulated a library of data. We were starting to collect so much data it was hard to keep information straight. We needed a way to logically store all of this information for quick & easy access.
Keeping Track of Data Geospatially On A Google Map
The idea of creating a data repository at each well’s “virtual location” on a digital map became the vision as to how to keep things organized. This is the moment that the concept of creating RMP’s own proprietary mapping software was born. We were already tracking the latitude & longitude of these 57 HVHF wells scattered across the Lower Peninsula. We were collecting drilling permits & completion logs as well as getting out into the woods to keep a photo log of every single HVHF well’s chronology in Michigan. Our #1 volunteer, Neo, was racking up 1000’s of miles on his on-road/off-road motorcycle to get photographs; he was everywhere.
When FERC issued a permit to Cheniere to export LNG, it was clear to me that I was going to have to learn all about liquefied natural gas in pursuit of my new passion to learn about energy infrastructure. From 2011 to 2015, I was locked in on searching the globe for LNG terminals, collecting their names and lat/lons like a kid collects trading cards. RMP launched our first LNG map in 2015 at about the same time Cheniere was commissioning their first LNG cargos to international customers. RMP published our first LNG report about Cheniere’s Sabine Pass location on August 14, 2015. It’s hard to believe how far RMP has come in understanding the global landscape of LNG and oil & gas in general since those early days in 2008.
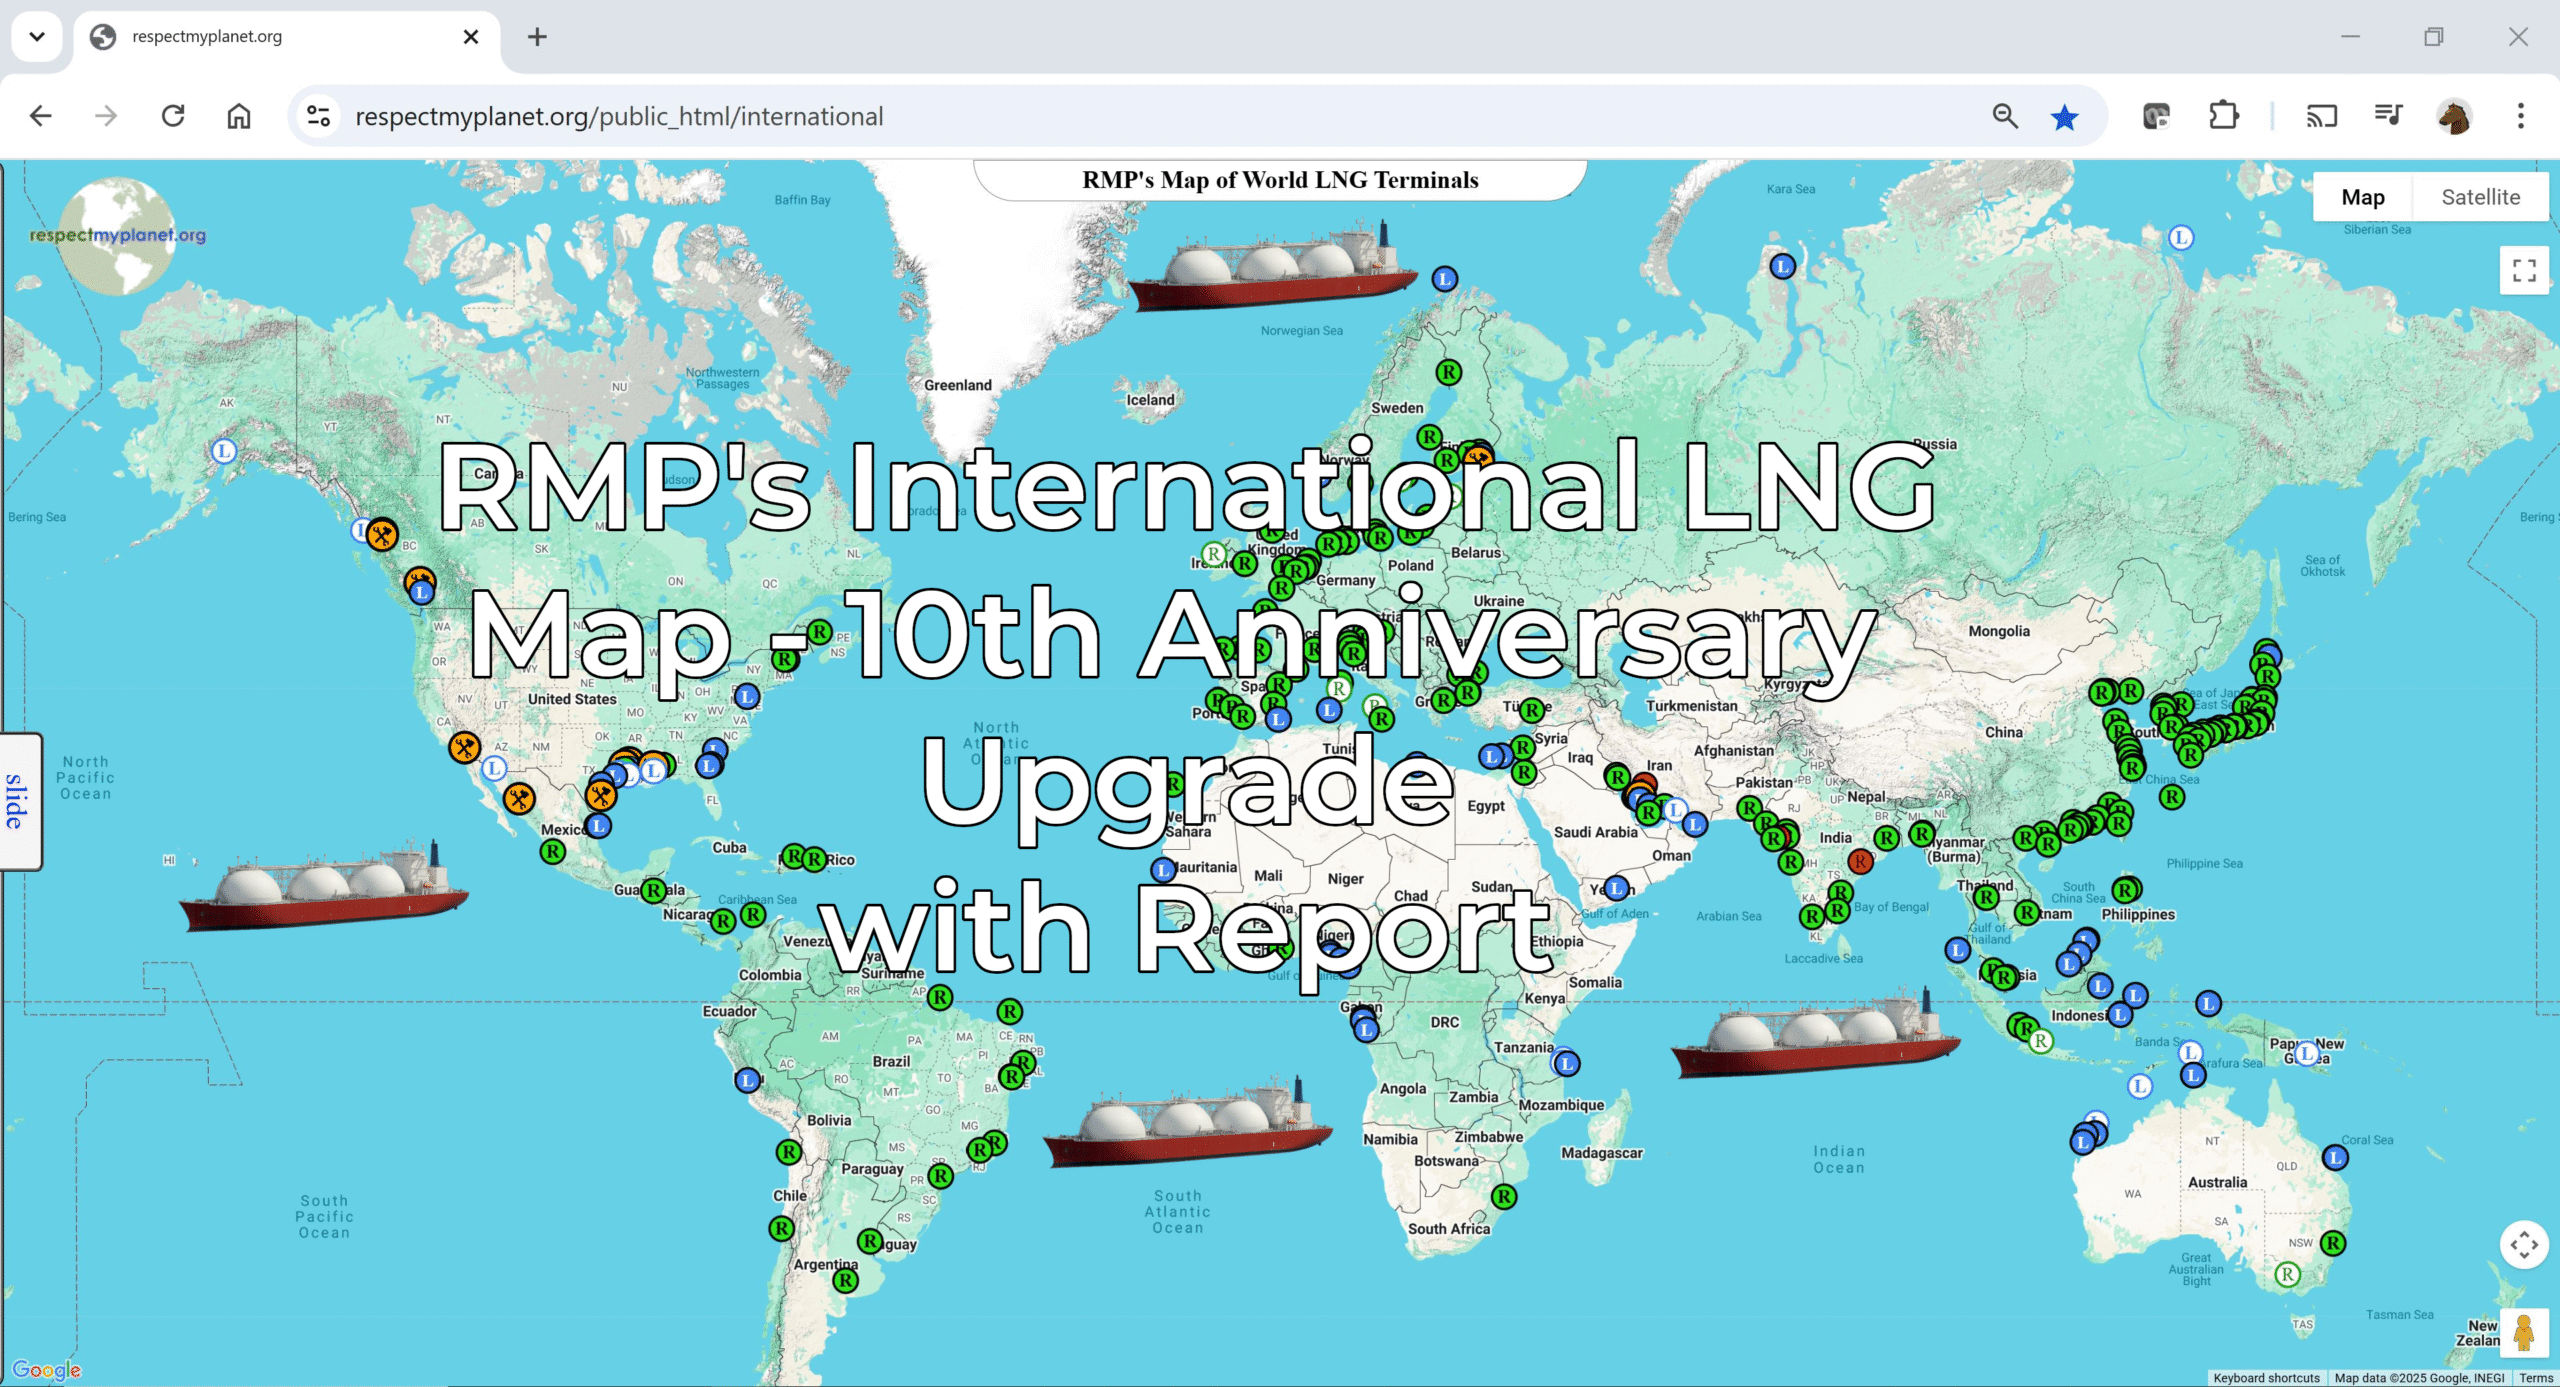
While collecting all these different datasets over the past 17 years, I have also been working to develop RMP’s mapping software in order to make tracking these LNG terminals easier. RMP has been tracking LNG locations, Michigan oil wells, hydrogen infrastructure, the lithium-ion battery supply chain, environmental remediation sites, and more for nearly two decades now. This version of RMP’s mapping software for our LNG upgrade is now up to version 3.0 as of April 2025. Being the 10th anniversary of our LNG map, I have ported all of RMP’s LNG data to our newest mapping software and given the data a refresh which includes hand checking 302 terminal locations over the past three months. Because I work full time at my day job, this is how I have been spending many of my nights, weekends, and vacation days for nearly two decades now. What better way to showcase this journey of hard work by releasing this 10th year anniversary LNG map. RMP’s LNG map is free to the public just like all of RMP’s interactive maps in the “Map Library” link above.
Let’s dig into this freshly upgraded map and go over the depth of our LNG data. If you want to find information about LNG terminals all around the world in an easy to use and free format, RMP’s LNG map is 2nd to none. Click on the link below to open the map and bookmark it.
Overview of Data Underpinning Our LNG Map:
There are 302 unique records in RMP’s LNG database: 88 liquefaction terminals and 214 regasification terminals. 13 of the 88 liquefaction terminals are floating units (FLNGs). 51 of the 214 regasification terminals are floating units (FSRUs). By country, the USA has gone from that one Cheniere liquefaction terminal in Sabine Pass, to the #1 country in liquefaction capacity online, planned, and under construction. Each location in RMP’s LNG database tracks: the number of liquefaction trains the facility has (not all trains are the same these days), the liquefaction capacity of the terminal in MTPA (Millions of Tons Per Annum), and storage capacity in m3 (cubic meters). RMP also has a ton of other information for each facility like its location, the operator, the operator’s website, whether it’s a floating unit, it’s first cargo date (or planned 1st cargo date), and cool link to marinetraffic.com so you can see the location on a live (real time) map. Looking at a location live is cool if you like to track LNG carriers around the world which is a surprisingly fun way to learn global geography. You can click on any location on the map to open that location’s homepage where you can see all of its related information. In later sections of this report, you will see an overview of how to use this awesome generation 3.0 map.
In the table below, I have summarized the data from RMP’s LNG database to show liquefaction capacity by country as of April 2025. You can see that the USA by far has the most LNG liquefaction capacity in the world. Qatar’s Ras Laffan complex is by far the largest single liquefaction location in the world and is even growing larger as I write this. Australia has nearly as much online capacity as the USA and has swapped 2nd & 3rd place with Qatar multiple times over of the past few years. An interesting country to watch in the coming years is Russia. Russia has plans that are even bigger than what’s in the table below. Because Russia operates in the Arctic, they not only have a fleet of really cool ice breaking ships, they’re actually building a nuclear submarine that will go right under the ice and move almost twice as fast an LNG ship; cutting shipping times from 20 days to 11 or 12 days. President Putin’s proposed LNG submarine technology that Russia is planning to demonstrate sounds really interesting and RMP will be following developments closely.

RMP’s latest global tally shows that total LNG liquefaction capacity—counting all operational, planned, and under-construction terminals—approaches 1,000 million tons per annum (MTPA) across 27 countries worldwide. Not all planned terminals will result in a positive F.I.D. All in globally, RMP calculates 981 MTPA with the USA as the top online producer, top planned capacity, and under construction capacity. By mid-2022, the U.S. had overtaken both Qatar and Australia, solidifying its position as the top LNG producer globally. All USA locations have been verified with FERC’s Q1-2025 publications for this report. Click on any “Planned” or “Under Construction” location in the USA on our map to see its FERC docket# on that location’s detailed homepage. Link to interactive international LNG map.

US LNG Exports Reporting – First 10 Years
RMP will be reporting on export data from the USA in this section since cargo #1 in 2016. Even though RMP’s map is having its 10th anniversary, the USA only has 9 full years of technical data to report from with this 10th year still in progress at the time of this writing. While we’re always searching for new global LNG reporting sources, RMP is a US based 501(c)3 non-profit. Therefore, we tend to focus on the USA and North America in our reporting. In this section we will look at the first 10 years of LNG exports with point of exit in the contiguous United States. In this section, data comes from the US Department of Energy’s Office of Fossil Energy and Carbon Management through December 31, 2024 and was published on February 24, 2025. As we have done frequently, scroll down to the appendix at the bottom of this post to see more information about our data sources, symbology, and conversion factors used. RMP converts all USDOE reporting in MMCF to MTPA. We convert 48,700 MMCF to one million metric tons for MTPA conversion & to keep reporting units of measure consistent with liquefaction & regasification capacity. This US data is freely available for download if you want to see the reporting in straight MMCF.
Let’s now take a look US exports by point of entry or exit and see where US LNG is coming from and where it is going. Remember, just because Japan has the highest regasification capacity in the world, it doesn’t mean they import the most gas every year. As mentioned earlier, China was the #1 importer of natural gas in 2023 and 2024. Many LNG articles over the past couple years envisioned US liquefaction going to China. Currently, President Trump’s actions have curtailed that possibility. The tariff war could also impact FID’s on planned US liquefaction capacity. China seems to be cozying up to Russia for natural gas and President Putin has ambitions of more liquefaction capacity than is on RMP’s tables. Arctic LNG #2 is supposedly in the works directly across the Gulf of Ob from Yamal LNG at Sabetta. RMP’s dark horse prediction for LNG capacity increases over the next 10 years is Russia. I am expecting China to increase its use of natural gas over the next 20 years to displace coal in order to lower its CO2 emissions and hit its decarbonization targets. I am also expecting most of this natural gas to come from Russia via pipeline and LNG.


RMP’s LNG Map Concept & Explainer
RMP’s LNG map, like all of our maps, shows a little SVG marker icon on a standard Google Map. All of the standard Google Map features are available like quick zooming in & out with your mouse wheel, Streetview, and the ability to toggle between ‘Terrain’ style & ‘Satellite’ style. That’s no different than any Google Map you’re used to that shows restaurants, golf courses, or shopping locations. What makes RMP’s energy infrastructure and environmental remediation maps different is the data under the hood. Think of the map you’re seeing on the screen as the tip of an iceberg: you’re seeing 1/8th of the information and the other 7/8ths is below the surface.
Each location on the map is kind of like a facebook page for that location. Think of each location as a geospatial media storage location. RMP stores information like operator name, operator logo, liquefaction capacity, LNG storage, first cargo date, terminal status, and the ability to use marinetraffic.com to see the LNG terminal in “real time” so you can check out what ship is or is not at port this very minute. Another feature recently added is the ability to easily attach news stories or URL links to the location. Now that the meat & potatoes of the software is complete, adding more features like community notes, images, videos, etc will be easy. Click on any marker on the map to open its homepage to learn more about it and keep checking back for new features.
If you’re interested to help add more data to our map, follow us by subscribing to the blog or following us on our socials. We will be posting soon about new login features so you can create a free account. The ultimate goal is to have more people interested in energy to help pin data to our maps. Again, just like facebook: the more people adding content makes it better for everyone else’s surfing pleasure. Just think, the data tables you see above all come from this wealth of information underpinning our map. We have ~300 LNG terminals and their details representing locations all the way around the globe.
Protip: it’s really fun to zoom into a location you’re interested in and use the Google Street View feature to see what it looks like on the ground. Now with Google Lens, you can also get help reading street signs and billboards in foreign languages you do not speak. Google lens is a pretty cool feature. Most educational maps are built using ArcGIS software which has its own features, but I find Google Maps are 10x faster than ArcGIS maps and way more fun to use. The biggest feature difference though is Google Steetview; ArcGIS doesn’t have anything that comes close to Google Streetview. This is what sets RMP’s educational maps apart from Government maps and University maps which tend to be boring, slow, and weak on querying capability. By contrast, RMP’s maps are fun, fast, and we “roll our own” queries. If you want to use ArcGIS, you need a $3000 license and pay $750/year maintenance. If you want to subscribe to RBN Energy’s ‘Back Stage Pass’ it’s $4,000/year for a single user. RMP’s information (in some regards) has some features better than both of those, and it’s free! Google allows RMP to use the Google Maps API for free because RMP is a 501(c)3 non-profit organization.
RMP’s LNG Map Control Panel

When RMP’s International LNG Map is first loaded, the default view is all markers are visible and the control panel is hidden. In the #1 arrow above, if you click the “slide” button the control panel slides out as shown above. In the #2 arrow above, you can click on any of the four buttons to show different panel views. The default view is “Marker Groupings”. From this panel, you can check or uncheck different groupings of markers to make them appear or disappear depending on what you want to see. In the #3 arrow above, you can see all markers are “checked” so they’re visible. Easily turn all markers off by unchecking the top checkbox and only turn on the markers you want to see. For example, if you want to see only LNG Liquefaction terminals “Under Construction”, click the top checkbox to turn all markers off, then select only the liquefaction “Under Construction” checkbox to only show those markers.
In the #2 arrow above, you could also click the “Marker Info” button to change the view in the control panel to see the listing of all the markers that are active on the screen. You can see the operator’s logo and terminal name. Easily launch a terminal’s location homepage by clicking the “i” icon from the control panel or clicking the marker on the map.
Also, underneath the marker checkboxes are some polyline checkboxes that show some standard shipping routes for Cheniere’s contracted customers from both their Sabine Pass location & their Corpus Christi location. Click on any of those checkboxes to see shipping route from port to port to some of Cheniere’s real customers. This feature (& more) will be expanding as more features are being added all the time. Keep checking back, subscribe to the blog (we don’t post too often and never spam), or follow us on “socials”.
LNG Map Liquefaction Icon Key:
All markers on the map can be clicked to open that terminal’s location homepage. Below is a key of the four different statuses of liquefaction & regasification terminals around the world.
Liquefaction Terminal Online – Receives natgas, liquefies it, stores it, & loads it onto a ship for marine transport to a regasification terminal
Liquefaction Terminal Planned – Permit issued and docket number created, moving toward Final Investment Decision (FID).
Liquefaction Terminal Under Construction – FID was yes, terminal is under construction
Liquefaction Terminal On Hold – This terminal’s progress was stopped due to economic sanctions or some other reason(s).
LNG Map Regasification Icon Key:
Regasification Terminal Online – Receives LNG from ship, stores it as liquid, regasifies and distributes it to the buyer’s pipeline network
Regasification Terminal Planned – Permit issued and docket number created, moving toward Final Investment Decision (FID).
Regasification Terminal Under Construction – FID was yes, terminal is under construction
Regasification Terminal On Hold – This terminal’s progress was stopped due to economic sanctions or some other reason(s).
Final Thoughts – LNG Map’s 10th Anniversary
It has been an amazing journey learning about natural gas, crude oil, hydrogen, and batteries over these past 17 years. This 10th anniversary of our LNG map brings back memories of searching the internet country by country looking for terminals from the satellite view. I remember travelling from Detroit to Mexico City for my day job for a week or two at a time. I would be away from my wife and kids stuck in a hotel room in a foreign country. I would spend every night and all weekend looking for LNG terminals after working at the plant all day. I will never forget that effort to make this LNG map. There was also some beer and music involved.
The biggest improvements over the years have been in the software and this version 3.0 of RMP’s maps. Everything is uniform now. It’s a coder’s favorite thing to do now: optimize & refactor. RMP has just started building out our login system so users can login to our website and add information to our databases. We now have a Lithium-ion Supply Chain GIS map underpinned by the NAATBatt database with about 800 locations. We have a North American Hydrogen Infrastructure map that has about 400 locations. We also have this map with approximately 300 LNG terminals in every corner of the globe.
Having these databases gives RMP a foundation to make calculations on things like LNG capacity by country or LNG storage by continent or so many other queries. Being able to pin photos, news articles, videos, docket info (pdfs), and export history gives RMP the flexibility to easily add cool features to these maps. One of the coolest things going on right now in the LNG world is Putin’s announcement of a Russian LNG carrier submarine with an expected 180,000 deadweight tonnage (DWT). That is an enormous submarine. Current LNG carriers with 150,000 DWT generally carry between 160,000-170,000m3 of LNG. This is something RMP will be keeping a close eye on as well as so many interesting other stories. See if you can find Yamal LNG or Arctic LNG on the northern coast of Russia on RMP’s map. Click on the icon, visit the homepage, and check out the attached links documenting things like this new nuclear LNG submarine.
Thanks for reading. RMP is a small unfunded 501(c)3 environmental organization registered in Michigan. We have been a watchdog for Michigan’s freshwater since our founding in 2008. Our software is all written by hand from open source & free platforms like XAMPP, Notepad++, the Google Maps API, PHP, JavaScript, and now ChatGPT too. We are only survived because of my full-time day job to pay for webhosting & non-profit registration costs. All coding time spent (1,000s of hours) and time in the woods photographing oil wells has been done by RMP volunteers. RMP provides free information to the public so they can learn more about sustainable energy and bridge energy like natural gas. RMP’s mission is to understand and share energy information while advancing a sustainable future that protects the world’s most valuable natural resource: our freshwater. To help cover our modest costs, please consider making a tax-deductible donation through our secure Paypal link below.
Appendix – Sources, Units & Conversions
LNG Export Data – U.S. Department of Energy, Office of Fossil Energy and Carbon Management. U.S. Natural Gas Imports, Exports, and Re-Exports Summary. Washington, D.C.: U.S. Department of Energy, February 24, 2025. Accessed April 21, 2025. https://www.energy.gov/fecm/regulation.
Units / Conversions:
$$
1 \, \text{MMCF} = 1,000,000 \, \text{cubic feet (ft}^3\text{)}
$$
$$
1 \, \text{Bcf} = 1,000 \, \text{MMCF} = 1,000,000,000 \, \text{cubic feet (ft}^3\text{)}
$$
$$
\text{MTPA} = \frac{\text{MMCF/year}}{48,700}
$$
Example calculation (converting 974 Bcf/yr to MTPA):
$$
974 \, \text{Bcf/year} = 974 \times 1{,}000 = 974{,}000 \, \text{MMCF/year}
$$
$$
\text{MTPA} = \frac{974{,}000}{48{,}700} \approx 20.00
$$
$$
974 \, \text{Bcf/year} \approx 20.00 \, \text{MTPA}
$$
Leave a Reply