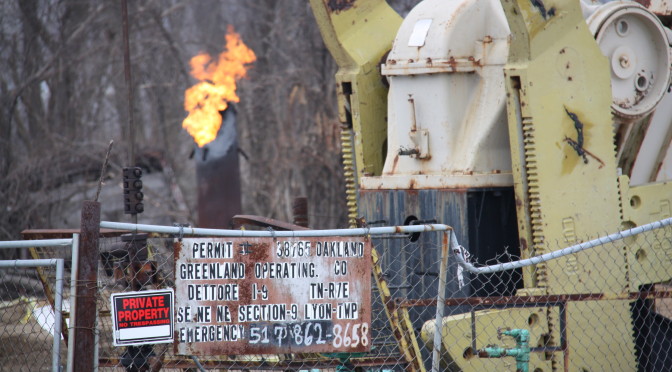
Welcome to Volume 3 of the Michigan Oil & Gas Monthly for March 2015. In the featured image above is a March 2015 photo of the Dettore Et al 1-9 well in Lyon Township, Michigan. This Oakland County well is at the crossroads of Grand River, Milford Road, and Pontiac Trail in downtown New Hudson. The well is just south of the only runway at the Oakland Southwest Airport which was formerly called the New Hudson Airport. Surveillance cameras and No Trespassing signs surround this well pad that runs right along side the Huron Valley Trail. The flare stack burns 24/7 and most likely attracts kids like a porch light attracts moths as it looks to be heavily damaged by mischievous behavior over the last 20 years.
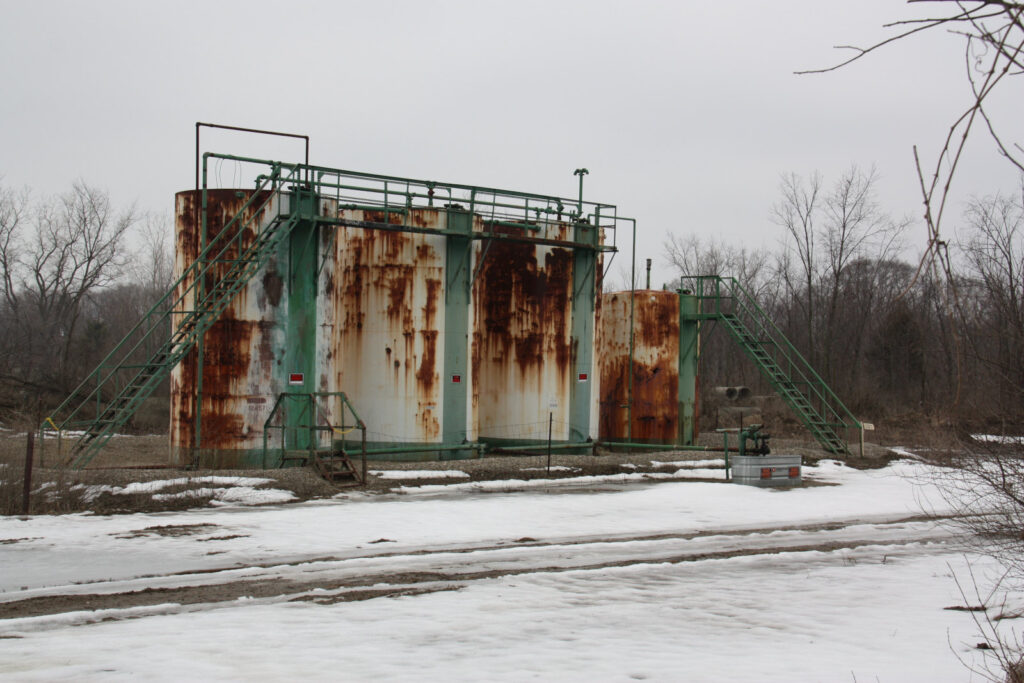
The Dettore Et al 1-9 well was completed May 29, 1985 into the Niagaran Gray formation. It has reported production of 423k barrels of oil over 17 years and 1 month. Although it looks active, as evidenced by the flare stack burning 24/7, the well does not have reported production since December of 2011. Although there is a oil & water separator and a waste water tank on the well site that can be seen from the Huron Valley trail, the well has not reported any waste water production in its 17 year exisistence. This well was listed on the 1993 SAP list for contaminated soil.
Click here to see the location homepage for the Dettore Et al 1-9 well and 35 more photos of the well. Every oil & gas well in Michigan has its own customizable homepage at RMP that serves as an electronic repository for pictures, videos, documents, and hyperlinks to websites. RMP location homepages for oil & gas wells also show hydrocarbon production information as published by the MDEQ where applicable. Watch this short video to learn how to search for wells near your house or anywhere else in Michigan.
March 2015 activity in Michigan includes the Westerman 1-29 HD1 well in Rapid River township transferring ownership from Encana Oil & Gas to Chevron Michigan LLC. RMP has been following the Westerman 1-29HD1 well since its inception. The Westerman 1-29 HD1 well is on the Michigan High Volume Hydraulically Fractured list of wells published by the MDEQ. The map markers on RMP’s homepage map correspond to the MDEQ’s HVHF list. We will be taking an in depth look at all the wells on the MDEQ HVHF in the coming months.
Another well worth mentioning this month is GeoSouthern’s McKenney 1-27P & 1-27 HD1 well in Sanilac county. The permits for both McKenney wells, the pilot hole and the horizontal drain hole, expired just this past week. This most likely marks GeoSouthern’s definitive exit from the Michigan Basin for oil & gas exploration as they join a growing list of operators who have had no success producing hydrocarbons by targeting the A1 formation.
The picture below is a screenshot from the weekly permit listings published by the MDEQ. The picture indicates that a well on land owned by the City of Traverse City will have production suspended until oil prices improve. Complexities arise when public resources are used for generating private profits. The picture below demonstrates why RMP has interest in understanding the differences between oil & gas exploration for energy and oil & gas exploration for profit; it is difficult to know when and where these two competing motivations intersect. Follow us each month here on this webpage to read the Michigan Oil & Gas Monthly magazine as we explore energy issues and make in depth analysis regarding oil & gas production, economics, environmental impacts, and taxation issues. Follow us on Twitter and/or like us on facebook and/or subscribe to our YouTube channel so you don’t miss our monthly magazine.

Now, let’s take a statistical look at March 2015 activity in the Michigan oil patch.
The State of Michigan received 9 applications for wells in March: 4 oil wells, 1 waste water disposal well, and 4 gas storage wells. Gas storage wells are infrequently applied for and this month we have 4. The Wyotex oil well targeting the A1 with a horizontal drainhole is interesting as it indicates WyoTex is not just taking a stab at the A1 but may actually be making a concerted effort at it. Wyotex has been targeting the A1 just like Devon, GeoSouthern, Whiting, Rosetta, and Alta have tried in recent years; none of those operators have had any success.
If Wyotex strikes out, they will join a long line of operators who have tried and failed over the last 5 years by targeting the A1 formation. The A1 has producing wells you can find on RMPs map using our formation search, but it was never targeted until recently because of advances in drilling and completion technology. You can stay abreast of oil & gas leasing activity and blurbs about companies operating in Michigan like WyoTex by following Edwards’ posts on the Natural Gas Forum Leasing page. In this post here from 2013 Edwards announces Wyotex arriving on the scene in Michigan before anyone else.
New apps for March 2015 are shown below:

There were 8 new permits issued to operators in Michigan in the month of March. All 8 permits were for oil wells with 7 new wells and 1 rentry.

There were 34 wells reported plugged in Michigan in March 2015. Remember, RMP reports wells plugged in the month they were reported by the MDEQ. Often times the plugging date is in the past and the paperwork is processed by the MDEQ and published in subsequent months. In fact, this month has an interesting update: a well reported plugged this month has a plug date of January 16, 1951.

Key Performance Indicators
Although there is not a direct proportion between apps and permits to wells drilled and completed, there is a direct relationship between applications made, permits issued, wells drilled, and wells completed. Below are some key performance indicators or KPI’s in the Michigan oil patch that can be helpful in supporting the findings we publish.
The 5 Year Trend Number of Permits Issued Per Year KPI:
The number of permits issued each year is indicative of interest in Michigan hydrocarbon exploration. We exclude the first year 1927 from our ranking system as permits were partial that year. Using 1928 as the first full year of recorded permit history in Michigan we have data for 87 years of activity. All rankings then are the number of permits in the year specified out of 87 total years. The apex year for permits issued in Michigan was 1992 with 2,024 permits issued. The nadir point was 1931 with 111 permits issued. The 5YR Trend Permits Issued KPI looks at the permits issued ranking over the last five years. This KPI will remain static through 2015 and analyzed against the 2015 permits as we go. Below is the summary of the year, the number of permits issued, and that year’s rank with a denominator of 87 years.

The Apps to Plugs Ratio KPI:
The apps to plugs ratio is self explanatory. By looking at the number of applications to wells plugged KPI we can see wells coming vs wells going. This KPI along with the previous one supports our original 2014 & 2015 outlook post with more numbers and data.
2015 Apps to Plugs Ratio KPI:
21 Applications : 98 Wells Plugged
The Permits to Plugs Ratio KPI:
The permits to plugs ratio is nearly the same as the apps:plugs ratio but with permits instead of applications.
2015 Permits to Plugs Ratio KPI:
28 Permits Issued : 98 Wells Plugged
Here are a couple other mentions of activity in March 2015:
The State of Michigan let Merit Energy temporarily abandon 64 wells until March of 2016. Blue Bay also was allowed to temporarily abandon 23 wells until March of 2016. RMP is starting to track temporarily abandoned wells to make sure they don’t get forgotten. Many of these temporarily abandoned sites leave pumpjacks, oil tanks, waste water tanks, and other personal property infrastructure rotting in our public taxpayer owned wooded areas. The Koehler Kendall well on RMP’s homepage is a good example of something perplexing to us: the State Koehler Kendall 1-27 HD1 well keeps getting temporarily abandoned extensions but it will never produce. One of the benefits an oil & gas company receives as a result of continuing to receive temporary abandoned status extensions is that the operator gets to hold its lease of private or Michigan publicly owned surface property indefinitely and get cheap rent on that property as well. The rent for an acre of Michigan taxpayer owned land for an oil and gas operator is between $2 and $5 per year as outlined in this document on page 4 (link removed 404).
Other financial benefits for oil & gas companies in Michigan related to abandoning or holding personal property on publicly owned land include the phasing out personal property tax for oil & gas infrastructure. The reason given for reducing personal property taxes on oil & gas infrastructure is that it is supposed to provide the incentive for job creation. The legislation to reduce PPT does not seem to be working as promised or having any effect on job creation as evidenced by numbers reported here at RMP each month. These tax law changes do, however, create revenue shortfalls for counties that have oil & gas infrastructure that no longer receive any compensation for the lost use of that land or risks that the land is subjected to.

In fact, these tax exemptions might actually lead to the layoffs of Michigan workers like police officers, fire fighters, and school teachers. These changes to the tax law were sponsored because we were told the current laws were “job killers”. Some Michigan counties, however, will see diminished revenues as a result of these tax law changes. County offices will face the real possibility of needing to layoff Michigan workers to balance budgets. This is the exact opposite effect of what Michigan voters were told the bill would do. Out of state companies like Merit Energy in Dallas, Texas and Breitburn in Los Angeles, California are seeing the biggest benefits of these tax law changes while the opposite effect of what was promised is happening here at home. Michigan faces revenue shortfalls and lost jobs with reduced compensation as taxpayer owned land is tied up and put at risk of ground water contamination by the very infrastructure exempted.
The spirit of this PPT exemption legislation proposed by senators Jack Brandenburg of Macomb County’s Harrison Township and Patrick Colbeck of Wayne County’s Canton Township should be questioned. These senators should be asked to demonstrate jobs created by the changes they made to the law. Oil & gas activity is the lowest it’s ever been in Michigan’s history and continues to diminish. Feel free to ask these senators to demonstrate how their changes to the tax laws are benefiting Michigan. Ask them if the expectations are holding true as to how they were sold to Michigan voters. Ask them about layoffs of police officers, fire fighters, and school teachers in Michigan counties because of revenue shortfalls related to the changes they made to the tax laws.
2014 Production Numbers
RMP has been speaking of trends and drawing conclusions about hydrocarbon production activity in the Michigan Basin for years now. In the past few months, with our new publications platform, RMP is now publishing the hard data that supports the conclusions we have been reporting. All of the data and graphs you see below are consistent with all of our publications to date. The information below is a brief production history and overview for the period January 1, 2010 to December 31, 2014 (the past five years).


That’s about it for our reporting in March 2015. Thank you for reading. If you have any questions or have a suggestion, please leave a comment below. Come back next month to read a recap of the April 2015 activity in the Michigan oil patch. Stay tuned for our special report on 2014 production data where we will take an in depth look at the top producers using our exclusive map.
Leave a Reply