
RMP has added a new GIS database to our map library called the Lithium-ion Battery Supply Chain Map. In April of 2024, RMP set out to understand the data underpinning the nascent lithium-ion battery supply chain in North America. Each year, more batteries are being manufactured helping to electrify our vehicle fleet and more growth is projected. Lithium-ion batteries are a key powertrain component of BEVs (Battery Electric Vehicles), PHEVs (Plug-in Hybrid Electric Vehicles), HEVs (Hybrid Electric Vehicles), and FCEVs (Fuel Cell Electric Vehicles). All of these vehicles utilize varying sizes of li-ion batteries that are driving demand of raw materials, raw material processing, electrode manufacturing, battery pack assembly, and ultimately metal recycling at the battery’s end of life.
China dominates the li-ion battery supply chain as RMP has written about before. The IEA consistently publishes information about lithium-ion batteries telling us the entire supply chain runs through China in a major way and the USA is decades behind China in terms of mining, raw material processing, and electrode manufacturing. The IEA estimates that 70% of battery production capacity announced for the period through 2030 is in China.[1] There is no such thing as an American BEV or PHEV if the most critical and expensive part of the vehicle is made by a foreign country like China.
In the USA, the Biden administration has made significant strides in boosting the domestic lithium-ion battery supply chain through landmark infrastructure legislation. Key among these efforts is the Bipartisan Infrastructure Law, which allocates billions of dollars to modernize the U.S. electric vehicle and energy storage sectors. The law aims to reduce reliance on Chinese imports by incentivizing domestic mining and processing of critical battery-grade materials like lithium, nickel, graphite, manganese, and cobalt. Additional policies under the Inflation Reduction Act provide tax credits and grants for companies that invest in sustainable mining practices and mineral processing facilities within the U.S. These measures are designed to foster growth in the lithium-ion battery industry, which is crucial for the transition to clean energy technologies and the expansion of electric vehicles, all while creating new jobs and strengthening U.S. competitiveness in the global supply chain.
In this post, RMP will explain how our new map showcases the lithium-ion battery supply chain with real and substantive data. You’ll learn where the data for our new map comes from, the strengths & weaknesses of this data now, and RMP’s plan to enhance the data to be more valuable as the North American lithium-ion battery supply chain experiences exponential growth. Keep reading to learn more. If you want to get straight to the interactive map so you can zoom in, start clicking marker icons, and filtering the data in the map, click the link below to open the map in a new tab, then bookmark it.
CLICK HERE TO GO STRAIGHT TO THE NEW MAP
Where Does the Data in RMP’s Lithium-Ion Battery Supply Chain Map Come From?
The basis for RMP’s new lithium ion battery supply chain map is NREL’s NAATBatt database. The NREL database was originally published in February 2024. Through the summer of 2024, I started parsing out and homogenizing the NAATBatt data. Cleaning up the data is a necessary step to get it ready to be loaded into an SQL database. Once the data is shoehorned into an SQL format, it can be mapped out in RMP’s mapping software written for the Google Maps API.
After poring over the data for the past several months through these preparatory steps, RMP was just about to publish the map based on NREL’s February 2024 data. But in September 2024, NREL released an update of the data with a couple dozen new locations and some locations had been removed. So, rather than publish the older February 2024 data, RMP went back to the drawing board of downloading the new data and starting over with it. RMP’s new map uses the September 2024 data and it’s as fresh as it gets at this post’s publication date. When NREL releases new updates, RMP will go through the process again to always keep the data fresh. I have learned a lot about this database over these past several months. I will explain in the next paragraphs what I have learned.
The first thing to note is the NAATbatt database is not really a database at all, it’s an excel spreadsheet. The spreadsheet is split up by supply chain segment into 12 separate tabs. Each tab lists facility locations for that particular type of facility along with other information like product, address, company, website, etc. RMP is tracking the first six types of supply chain segments in the database and ignoring the last six as ancillary or less important. Here is a brief description of the six key facility types RMP is tracking for our new map:
- Raw Materials – Upstream – These locations are where raw ore is mined or lithium brine is extracted. As I was expecting, the NAATBatt database has America’s only active lithium mine Silver Peak and America’s 2nd lithium mine Thacker Pass which may open soon but is currently under construction at this post’s publication date. What I was not expecting, however, is how many other mining locations, the DB is missing. This is covered more in the strengths & weaknesses section along with RMP’s plan to fortify this database with our own supplemental information to make it more robust.
- Battery Grade Materials – Midstream – these are locations that eponymously turn raw material into battery grade materials. Think of anode material like synthetic graphite, or where raw lithium gets made into lithium hydroxide or lithium carbonate, or where cathode materials like nickel sulphate, cobalt sulphate, or manganese sulphate are made from raw ore.
- Other Battery Materials – Midstream – these are locations that make liquid electrolytes, additives, solvents, copper foil, separators, etc.
- Electrode & Cell Manufacturing – Midstream – these are locations that make things like lithium cobalt oxide, nickel cobalt aluminum oxide, nickel manganese cobalt, and other compounds used to make so many flavors of different cathode (and anode) materials.
- Module-Pack Manufacturing – Downstream – This category creates the components that would go into a finished battery pack or the finished battery pack itself. Battery cells get grouped into “cell assemblies” which are the subassembly parts of a finished battery pack. This is what America does now: we take raw material products from upstream and midstream facilities (which mostly come from China) and we package them into packs that fit the cars or trucks we make in the USA.
- Recycling – Downstream – These locations are where battery metals are recycled to be used again. Think of shredding packs into “black mass” and then separating the black mass back into raw materials again. Recycling is a very important part of making batteries more sustainable. But, this supply chain segment is very nascent and is mostly theoretical in terms of scaling and what percentage of material is or can be recycled. Recycling must be able to scale sustainably and that is not proven yet. This is one of the main reasons RMP is now tracking these locations: to substantiate recycling claims with real data and real locations.
It’s important to make the point that what we are doing now in America in terms of battery making is completely dependent on Chinese raw materials and refining facilities. We can’t make battery packs for Tesla Model 3s or Ford Mustang Mach E’s without raw materials and refined materials from China. The upstream and midstream facilities are the important ones for our economy and energy independence. The upstream and midstream facilities take decades to cultivate and RMP’s ambition is to track this data as the foundation of the lithium-ion battery supply chain in North America. Whoever controls upstream and midstream assets, controls the battery economy. We are dependent on China for these supply chain segments for years to come and will be a distant 2nd place to China for the next 20 to 30 years according to the IEA.[2]
The remaining supply chain segments in the NAATBatt database rounding out all 12 are: #7- Equipment, #8 – R&D, #9 – Services & Consulting, #10 – Modeling & Software, #11 – Distributors, and #12 – Professional Services. RMP is not tracking these indirect segments related to the supply chain of making batteries and battery packs. RMP considers segments #1 through #6 the real meat & potatoes of the battery supply chain.
Like RMP’s other maps in our map library, we take the data from sources like NREL and apply our data parsing skills to cleaning it up, homogenizing it, and stacking each of those MS Excel spreadsheets into a flat file that can be uploaded to a proper SQL database. Once the data is cleaned up and organized for a real database, RMP can integrate it into our mapping software.
With the data in an SQL table, RMP can create related tables to add data that the NREL database is missing. Having reviewed this data in detail for over six months now, I can tell you that many raw materials locations are missing. Missing raw materials mining facilities are a good example of locations RMP can add to the database that are critical for understanding additional locations versus relying on raw NREL data alone. And, maybe more importantly, RMP can also add meta data to records in the NREL database to mark those records as good data or bad data. If RMP discovers during our vetting processes (or our volunteers like you discover something), we can mark data records to exclude them from queries as not relevant (or vice versa). We’ll touch more on this in the next section. Think of NREL’s NAATBatt information as raw ore containing gold and RMP’s data as pure gold refined from that same ore.
Strengths & Weaknesses of the Raw NAATBatt Database from NREL
First off, it’s great that NREL has the resources to produce a database like this for public consumption. RMP is thankful to have access to it. Small non-profits like RMP do not have the resources to gather this type of data without funding. RMP started compiling this same data by hand and slowly building a database record by record not aware this database existed. It was through this slow “by hand” research work of adding locations one by one that I discovered NREL’s NAATBatt database and started exploring it. Finding the NREL NAATBatt database turbocharged the trajectory of bringing this map to life today.
As you get into the data and start to parse it out, you start to learn more about it. You start to learn what is great about the data, and what is not so great. RMP is only interested in the direct lithium-ion battery supply chain segments like upstream, midstream, and downstream assets. It’s nice that we can parse out all those indirect facility locations that are not important to our tracking objective and focus on upstream, midstream, and recycling assets. Segments #1 through #4 plus segment #6 of this supply chain determine who controls the economy and sustainability of the market as a whole.
Once you get to the most interesting data related to economic control, you still have to vet the data to remove bad records. For example, some records don’t have a latitude & longitude which will cause the Google Maps API to crash on that record. These records must be sorted out and removed. There are many other small tweaks this data needed to get it to work in an SQL database. Because it came from spreadsheet, the human data entry errors must be homogenized so intelligent queries can be made on the data. For example, if most of the raw material records have the type “raw material” and a couple dozen have the type “raw materials” that is a problem for queries. All records need to be either “raw material” or “raw materials”, the ending “s” is significant to an SQL query. RMP cleans up 100s of these types small issues so you and I can make powerful queries later.
Once you can get the GIS data to render on a Google Map, you can finally visualize it on a map which is a really cool moment. It’s like ascending a peak, and finally looking out into the foothills as far as your eyes can see. But, seeing all the markers spread across North America is also when you find more problems with the raw NREL data. For example, some records had a latitude & longitude, so they made the first cut, but when you render the map for the first time, you see markers in the middle of the Atlantic Ocean or in Africa and you know that lat/lon in the DB is incorrect. These records also wind up on the cutting room floor, or they must be corrected by hand. For example, you can manually look up the address then you might find the “real” latitude & longitude and correct it in the database to fix the record.
After months of this type of data vetting and writing procedures on how to do the same thing faster in the future when new database revisions get published, you start to notice more about the locations. Then, as you debug the software and more time goes by, you start to learn even more. One of the things I noticed is that many proposed lithium mines are missing. There are also no copper mines on the map and copper will play a critical role in an electrified future. It becomes obvious as I get deeper into the data that RMP will have to use additional data sources to supplement this map with more locations.
If you’re still reading this far into this post, it means you’re interested in tracking supply chain segments #1 through #6 just like us. And if that’s the case, please join us on this journey by subscribing to our blog below. We’ll be posting more updates and stories about America’s lithium-ion battery supply chain in the future.
How Does RMP Enhance & Supplement NREL’s NAATBatt Database?
RMP will add supplemental tables in a relational database that allow us to store meta data associated to the locations in NREL’s NAATBatt database. We can add pictures, links to articles, videos, user comments, and so much more all specific to the location id#. Most importantly with the NREL data, we will need to add more lithium mines and copper mines as completely new records. There really aren’t that many cobalt & nickel mines in the USA but more will be opened in the future. Speaking of starting a new mine in the USA, did you know the average permitting time for a new mine is about 7-10 years? Lithium America’s Thacker Pass mine started construction last year after >10 years of effort.

In order to make queries of RMP’s data more valuable & relevant, bad records need to be weeded out or marked as irrelevant. In the raw database itself, a record might qualify as a valid result for a query but it’s not really what you’re looking for. It’s like the old saying with computer systems: garbage in, garbage out. For example, the Cirba Solutions Recycling location in Wixom, Michigan is literally 10 minutes from RMP’s HQ so it caught my attention when I could see it on the map for the first time. It’s always the most fun to zoom in on the area where you live to see what is around you. You can check out some pics I took of the Cirba Solutions Wixom, Michigan location below.


I can verify the Cirba Solutions location is real, because I can see it as I drive to work every week for the past several years. I can literally see the “Now Hiring” sign out front the past couple years and know that it’s a real growing location providing real jobs in my own community. There were 26 different semi trailers, seven different Class 8 tractors, and a large building where material is recycled which you can see in the pictures. This building was even active on Sunday 10/20/2024 when I took photos. This is what we love at RMP: verifying with data that locations are real. This is the economy and the supply chain in action!
Here’s the snag though: in the NREL database, Cirba’s Wixom location is listed two times. This is problematic. Each duplicated record says the recycling capacity of the Cirba Solutions location in Wixom can shred/create 22.7 tons of black mass per year and has 80 employees. Since the record is incorrectly listed in the database twice, if you query calculations on it, you’ll get 45.4 metric tons and 160 people working there instead of 22.7 tons & 80 ppl respectively. If the data is not vetted, the query results are incorrect and misleading. These kinds of nuanced things are harder to find in a large data set and take time to review. The only reason I found this data error so quickly is because I was checking the locations in my community. Who knows what other data entry errors or DB administration issues are lurking deep in the data.
RMP intends to always be vetting this data and finding ways to make its reporting more accurate and meaningful. As a financial analyst working to protect large corporations’ sensitive data for over 25 years professionally, it’s been my job to represent the economic truth of the situation to CEO’s, CFO’s, and board members. These heavy weight decision makers use the data I provide that steer the company and people’s lives. RMP’s mission is to aggregate meaningful environmental data that tells the economic truth in terms of how water is protected and if something is truly sustainable. I apply the same data integrity checks to RMP environmental data I’ve been learning my whole professional career as a financial controller. RMP’s process of data review is never complete, it is a lifelong passion of continuous improvement.
Final Summary
RMP has been looking forward to publishing this 7th map in our map library all summer long. As a 501(c)3 that covers sustainable energy, it’s about time RMP is covering mining and mineral processing. Mines that use acid leaching techniques like those for lithium-ion battery materials should be understood better by the environmental community. It is important to understand how working with toxic metal tailings in waste water discharge can or cannot be done sustainably. Mining can have severe impacts on water quality if it’s not well regulated. Most metal mining involves acid leaching and the mining industry has a long checkered history of polluting rivers and other bodies of water going back centuries.
To ascribe climate change urgency as an excuse to ignore the impacts of acid leaching metal out of ore near drinking water reserves is foolish for any sovereign’s wealth. To ignore where batteries come from because you can’t see how they’re made or distributed is even more foolish. The USA’s goal should be to reduce prospecting and permitting times for new mines to under 4 years with comprehensive regulations that protect our water and air. We can accomplish both things. The key is to take less input from environmental radicals on one end and greedy billionaire charlatans on the other; decisions should be based on solid data and intelligent administration.
Currently, there is not much green or sustainable about battery making in China or its partner countries around the world. People tend to want to glaze over how destructive the lithium-ion battery supply chain can be on the environment. There seems to be an excuse that if the supply chain is half way around the world and we don’t have to see it, it’s ok to pollute the water and burn fossil fuels to make batteries because it’s for the greater good. That is a poor attitude toward sustainability and environmental justice. Mining poses threats to the environment and the supply chain must be held accountable no matter where it is in the world.
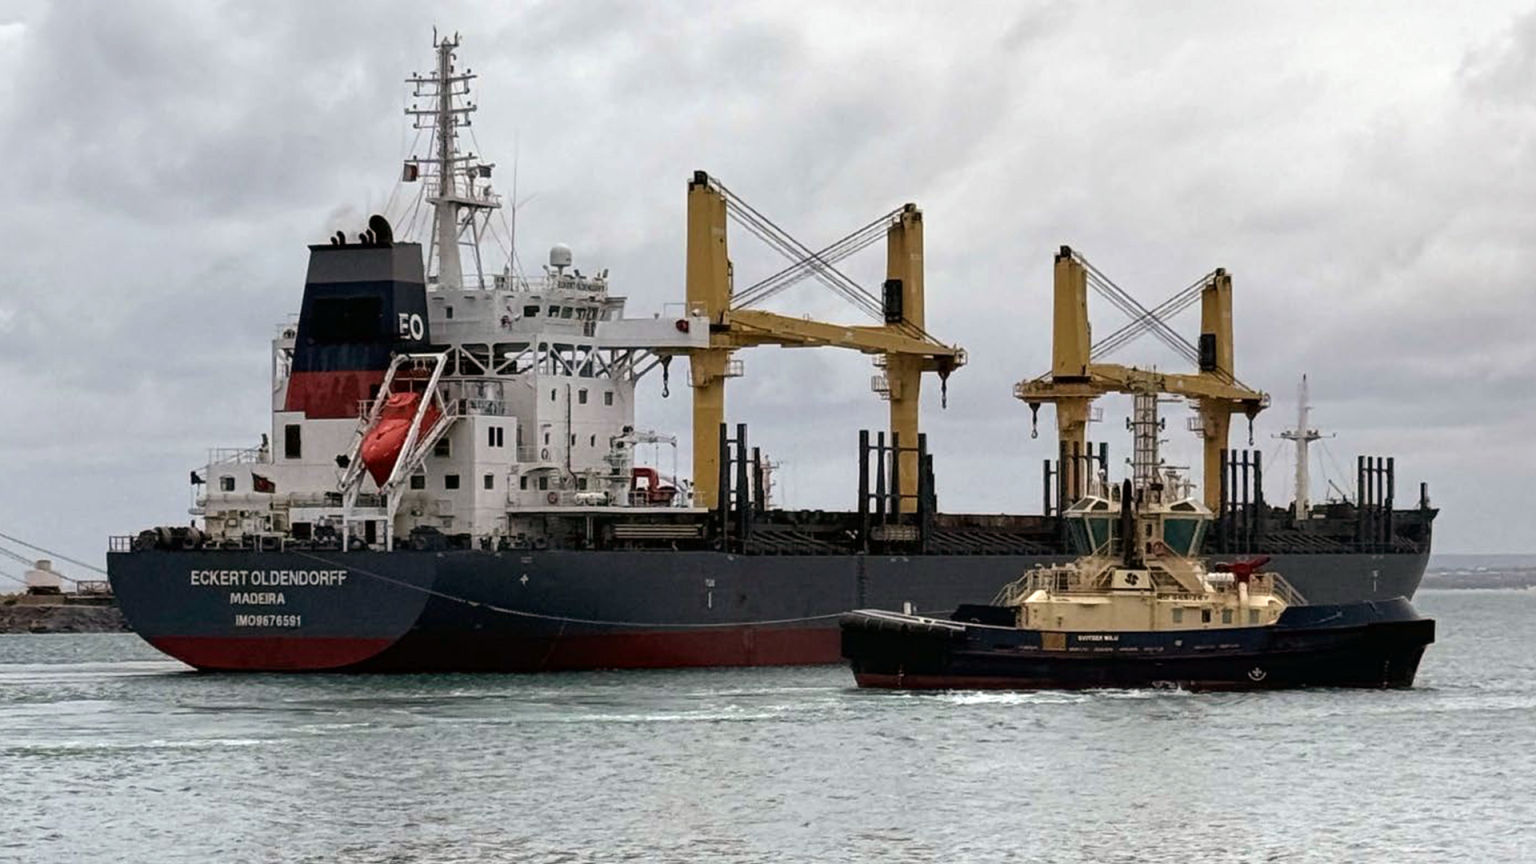
We are not holding other countries to the same standard that we hold ourselves to and that is bullshit for climate change zealots to ignore. While using fossil fuels and weak regulations is helping batteries become cheaper by discharging unregulated CO2 emissions, SOx emissions, mercury emissions, and toxic tailings, it is not sustainable. A classic example is nickel production in Indonesia. The economic boom from nickel in Indonesia over the past decade can be directly related to the rise of battery electric vehicles. Indonesia’s mining boom has spurred a sharp increase in coal power usage to fuel smelting operations and processing plants, intensifying environmental concerns.
This surge in coal consumption in Indonesia has led to severe environmental repercussions, particularly in terms of water pollution. The coal-burning process, combined with mining activities, has contributed to harmful runoff containing heavy metals and pollutants that flow into nearby rivers and coastal areas. In regions such as Sulawesi, where nickel operations are concentrated, communities have reported the contamination of water supplies, destruction of marine ecosystems, and threats to biodiversity.[3] As coal ash and mining tailings find their way into water systems, they pose serious health risks to local populations and ecosystems, exacerbating the environmental toll of Indonesia’s nickel-driven industrial expansion. This is not the way toward improving global climate change issues or a sustainable supply chain.

Nickel from Indonesia is just one metal and one microcosm to illustrate a point. There are an array of metals coming from an array countries all headed to China with similar environmental issues. All of the environmental concerns in the Indonesian case come before the smelted nickel even gets onto a diesel ship and travels to China to be made into a battery grade material with more fossil fuels. The same nickel gets integrated into a battery cathode then travels on a diesel ship back to America. If you call out a BEVangelist about this reality, they get puffed up and angry. Then they accuse you of being a shill for big oil. Usually, the conversation turns to how much better BEVs are than internal combustion engines as it relates to CO2 emissions.
Batteries are better than gasoline, but that is a super low bar. Do we ignore valid issues about water protection because the pot calls the kettle black? How can we make batteries in your community in a way that you would still be ok with? These are serious supply chain and cost issues that need to be addressed in terms of CO2 emissions, water pollution, fossil fuel consumption, and most importantly, sustainability. If we want to make responsible and sustainable batteries, we must do them right. We must make them in North America.
RMP supports batteries, but we must be objective when calling balls and strikes. Batteries should not get a free pass on serious sustainability objectives. The Thacker Pass spodumene mine under construction in northern Nevada, for example, is using advanced mining techniques to be environmentally neutral in its production of lithium using less fossil fuel. This is the way.
We need to foster the production of new energy metals in a sustainable way in North America, just like Lithium Americas is doing at Thacker Pass. We cannot turn a blind eye to China opening more coal plants each year than the world combined to make “green” energy metals for Western consumers. It’s bad for the US economy, bad for planet earth, and most importantly is not sustainable. If you would not make batteries in your back yard the same way you promote them, it is not a sustainable practice. I cannot see environmentalists cheering on an 800% increase in coal capacity to make battery raw materials in the USA like has happened in Indonesia over the past decade.
US environmentalists would lose their mind if a new unregulated coal plant was proposed to help smelt nickel while simultaneously cheering on lithium batteries as the solution to all the world’s green energy needs. We can agree that batteries will play an important role in a sustainable future, but we cannot ignore the regulations that will make the battery supply chain sustainable.

Over the next 15 years, the lithium-ion battery supply chain in North America is projected to grow dramatically. By 2035, the USA is projected to be the #2 producer of upstream and midstream lithium-ion battery materials and control 17% of global market share.[4] But, by 2035 China will still be a dominant #1, maintaining control of over 60% of the global supply chain. RMP will be tracking this massive expected growth of the lithium-ion battery supply chain in the USA over this next 15 years and beyond as America cements its place as #2 in the world.
RMP will remain grounded in the reality the lithium-ion battery supply chain is dominated by China as far out as we can see. Until we are making our own batteries in the USA with North American raw materials & refined materials & recycled materials, the lithium-ion battery supply chain is not really green or sustainable. We can get there but we have a very long road ahead and we should be trying to use smaller battery packs per vehicle to make resources go further.

What’s Next for RMP’s Lithium-ion Battery Supply Chain Map?
It was a lot of hard work to get this map launched and what a cool milestone it is to see the different colored markers rendered on a Google Map. Ironically, getting the map rendered and interactive on the www is just the beginning. Now comes the fun part and the deeper learning part. RMP’s plan is to do some deep dives and stories on this data. There is so much to be discovered, learned, and shared. RMP will be publishing more blog posts like this exploring the lithium-ion battery market as well as making short informative videos.
Subscribe to this blog to follow along. RMP is active on Threads, Reddit, Facebook, Instagram, and Mastodon. Please give us follow if you’re interested in the lithium-ion battery supply chain or any other environmental science RMP tracks.
How can you help?
RMP is small 501(c ) 3 non-profit organization operating in Michigan for just over 10 years. We are an unfunded organization operating on part time volunteer work and no money. If you can recognize the value in the research, data, and software we provide free to the public , we hope that you’ll consider making a tax-deductible donation to our organization. With funding, we could do more and reach more people. The information we curate is dedicated toward understanding how sustainable energy works and how to protect our freshwater resources. If this is something you care about, we are an organization that could use you as an ally. Thank you for reading and please share this post with others you think might be interested. Please consider making a secure and tax-deductible donation to help RMP by clicking here.
Footnotes:
Footnote [1] – International Energy Agency, Global Supply Chains of EV Batteries, IEA, https://www.iea.org/reports/global-supply-chains-of-ev-batteries, accessed October 20, 2024.
Footnote [2] – EU Science Hub. “SUPPLY CHAIN CHALLENGES – Batteries: Global Demand, Supply, and Foresight.” Raw Materials Information System, European Commission, https://rmis.jrc.ec.europa.eu/?page=analysis-of-supply-chain-challenges-49b749. Accessed 21 Oct. 2024.
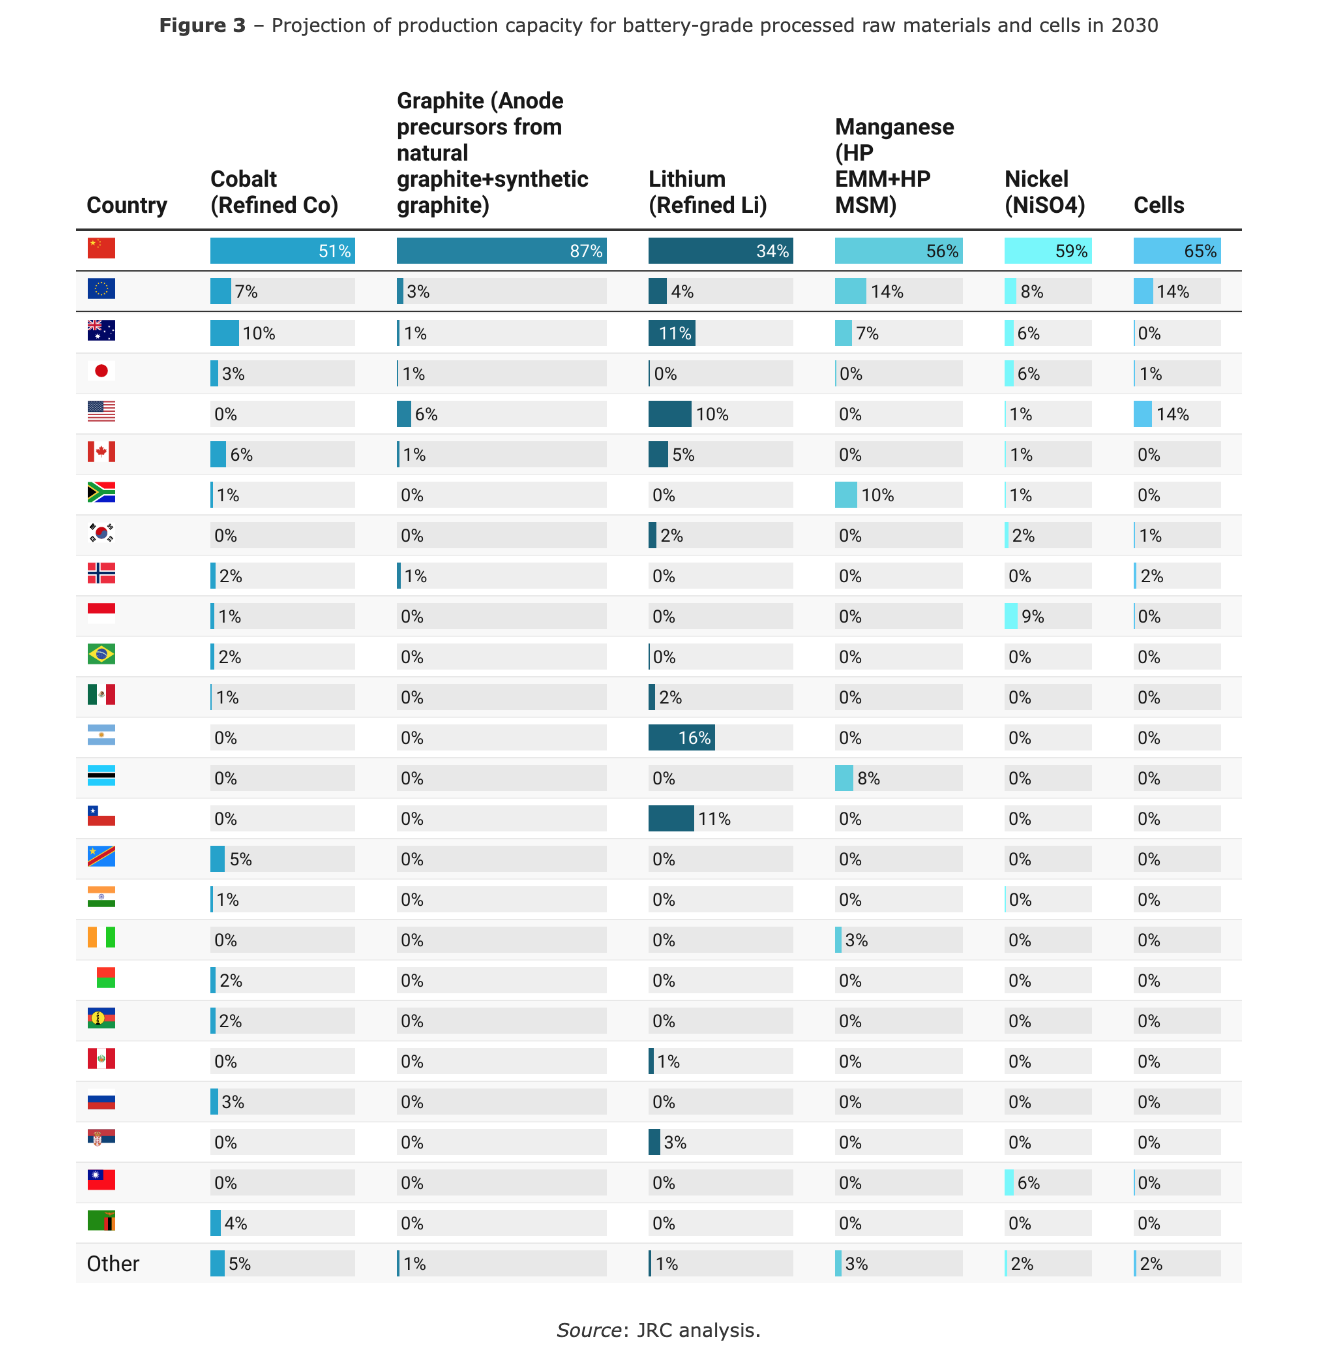
In 2030 China is forecast to account for 51% global cobalt refining, 87% graphite, 34% Lithium, 56% manganese, 59% Nickel(NiSO4), and over 65% of the average overall global battery market.
Fig1 – Global lithium supply outstrips demand in 2028 and diverges dramatically with demand higher than approx. 4x supply from primary & secondary resources. Click image below to enlarge.
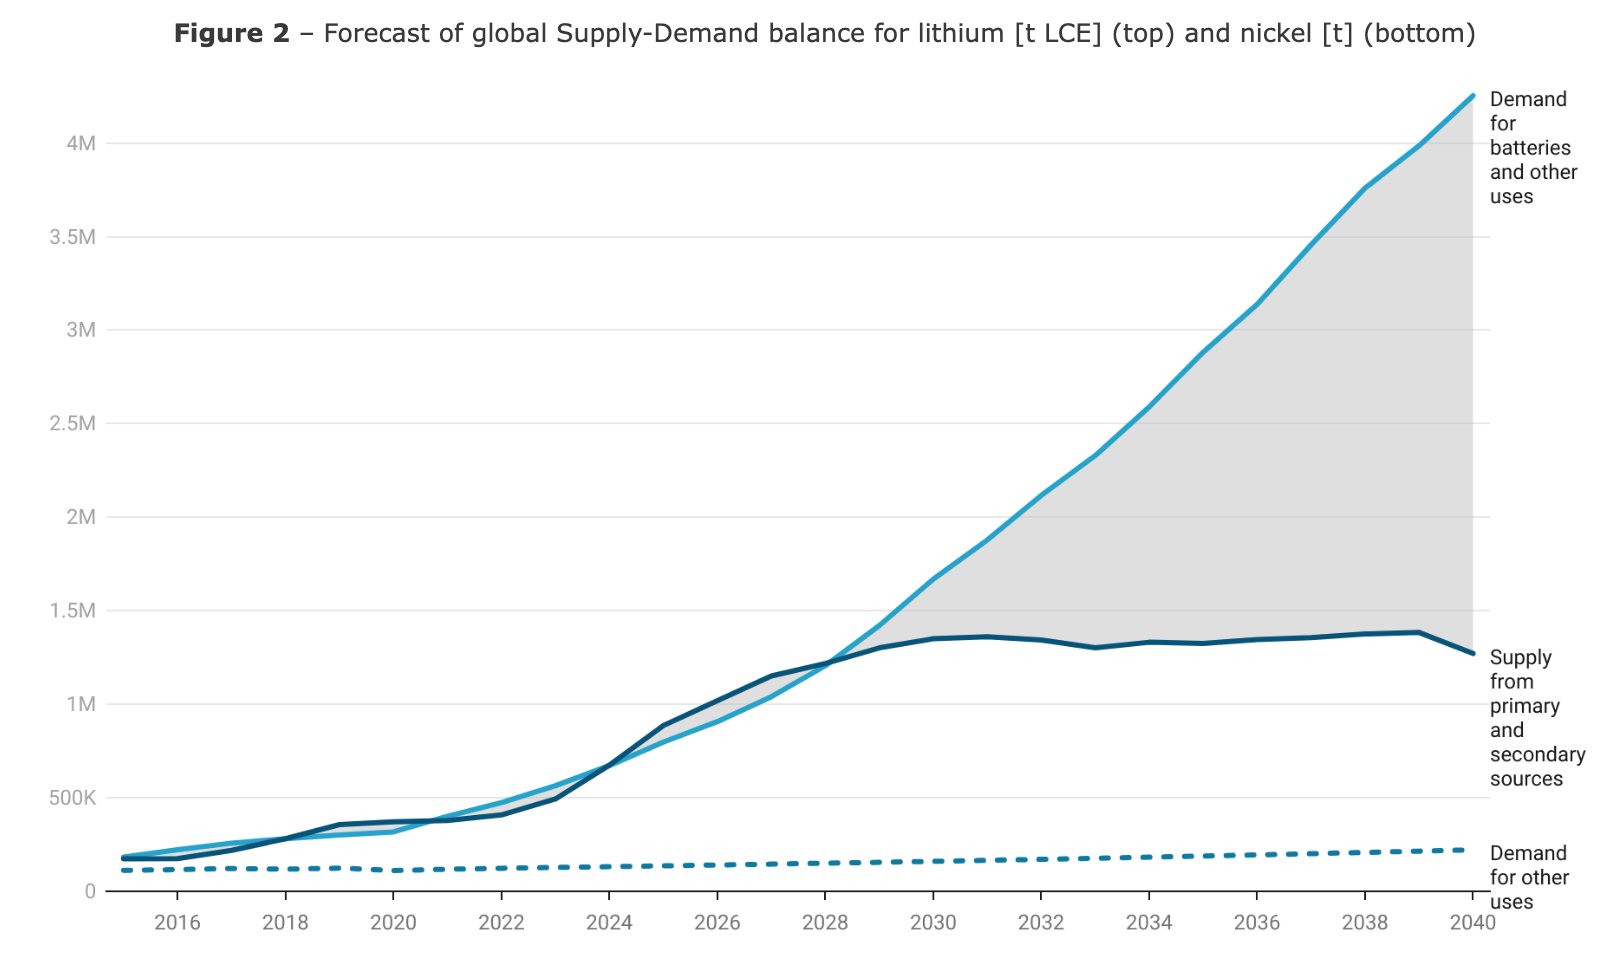
Fig3 – China will control 65% of cell making global market share in 2030 and command 87% global graphite market share which is a key raw material in cathode making. Click image below to enlarge.
Footnote [3] – Lotulung, Garry “Pictured: Indonesia’s net zero nickel boom fuels destruction of rainforests and coral reefs” The Telegraph 7 Aug 2024, https://www.telegraph.co.uk/global-health/climate-and-people/the-dark-side-of-indonesias-nickel-mining-boom/. Accessed 21 Oct 2024.
Footnote [4] – Venditti, Bruno “Ranked: The Top Lithium-Ion Battery Producing Countries by 2030” Elements Visual Capitalist, https://elements.visualcapitalist.com/ranked-the-top-lithium-ion-battery-producing-countries-by-2030/ Published 23 Aug 2024, Accessed 21 Oct. 2024.
Leave a Reply