Reducing Information Overload in the Battery Supply Chain
As datasets grow larger and more detailed, something counterintuitive often happens:
insight becomes harder to find. Over the past year, RMP’s work has focused on building a comprehensive, location-based view of the North American lithium-ion battery supply chain based on the NAATBatt database. The result is a single interactive map containing 835 facilities, spanning everything from raw material extraction to recycling. That full map remains essential. It establishes context, scale, and connectivity. But it also raises an important question:
How do we move from seeing everything to understanding something specific?
This post explains how recent improvements RMP has made to both enhancing the NAATBatt database and evolving our third generation mapping software now allow us to create curated, story-driven subset maps — starting with this first map of upstream lithium.
Recapping the Structure of RMP’s Full Lithium-ion Battery Supply Chain Map
Each facility in RMP’s version of the NAATBatt database is assigned a numeric prefix that corresponds one of six logical supply-chain segments, not just a data category. These prefixes are consistent across all metals and technologies. Each of the six segments fall into the standard three sections of any industrial supply chain: Upstream, Midstream, and Downstream. Every record on RMP’s main database table gets assigned one of these six segment types:
| Supply Chain Segment | Supply Chain Position & Description |
|---|---|
| Raw Material | Upstream – mining, brines, raw ore, and primary resource extraction |
| Mineral Processing | Midstream – conversion, refining, and chemical processing into cathode & anode precursor materials |
| Other Battery Components | Midstream – separators, electrolytes, foils, additives |
| Electrode & Cell Manufacturing | Midstream – cathodes, anodes, and cell production |
| Battery Pack Assembly | Downstream – modules, packs, and system integration |
| Recycling | Downstream – end-of-life recovery and secondary materials |
Peripheral or indirect activities were intentionally excluded to keep the focus on physical supply-chain infrastructure. To be clear, the NAATBatt database includes hundreds of additional records for equipment manufacturers (122), R&D (105), Service & Consulting (108), Modeling Software (31), Distributors (21), and Professional Service (41) that RMP leaves on the cutting room floor before porting the data to our SQL tables. RMP’s focus is primarily on Upstream, Midstream, and Downstream ‘direct’ locations as they are foundational to creating the domestic capability to make batteries in North America from soup to nuts.
The Full Map: Necessary, but Dense
RMP’s main North American Lithium-ion Battery Supply Chain Map brings together:
- NAATBatt locations from upstream through recycling
- Add’l upstream lithium prospects & copper mines added independently (+133 records)
- Nickel, cobalt, graphite, manganese, and iron facilities
- Data cleaning to remove malformed or ambiguous NAATBatt records
You can explore RMP’s full & comprehensive Lithium-ion Battery Supply Chain Map at the link below:
https://www.respectmyplanet.org/lithium-ion-battery/north-america/supply-chain
It is filterable by supply-chain segment and project status, and it serves as the foundational reference for everything that follows.
RMP has published two separate posts heralding and explaining how this massive map works and is put together. You can read this post and this post to learn more.
Even with filters applied to our main map, hundreds of markers remain visible at once. At that scale, the map is excellent for context, but less effective for focused learning. As an analogy, think of 835 data records as 835 people with something in common but each with their own unique story and smaller group of “friends” or associated records.
Making the full map was a necessary step to get “everybody in the same room” before we have the data to get to know each “each person” individually and their more detailed characteristics and their smaller subsets within the larger family. It was always RMP’s plan to get to this next step: curated maps of smaller “easy to digest” groups of locations. This is where the deep learning takes place and what gives SQL its power over data.
Curated Maps: Same Data, Narrower Questions
Because RMP’s third generation mapping software is now fully driven by SQL queries — rather than fixed map logic — it is possible to easily create specialized maps that are strict subsets of the master dataset, all drawing from the same underlying tables. The word “easily” in the last sentence is key to prototyping similar “subset” maps quickly. We look forward to making many more similar maps soon.
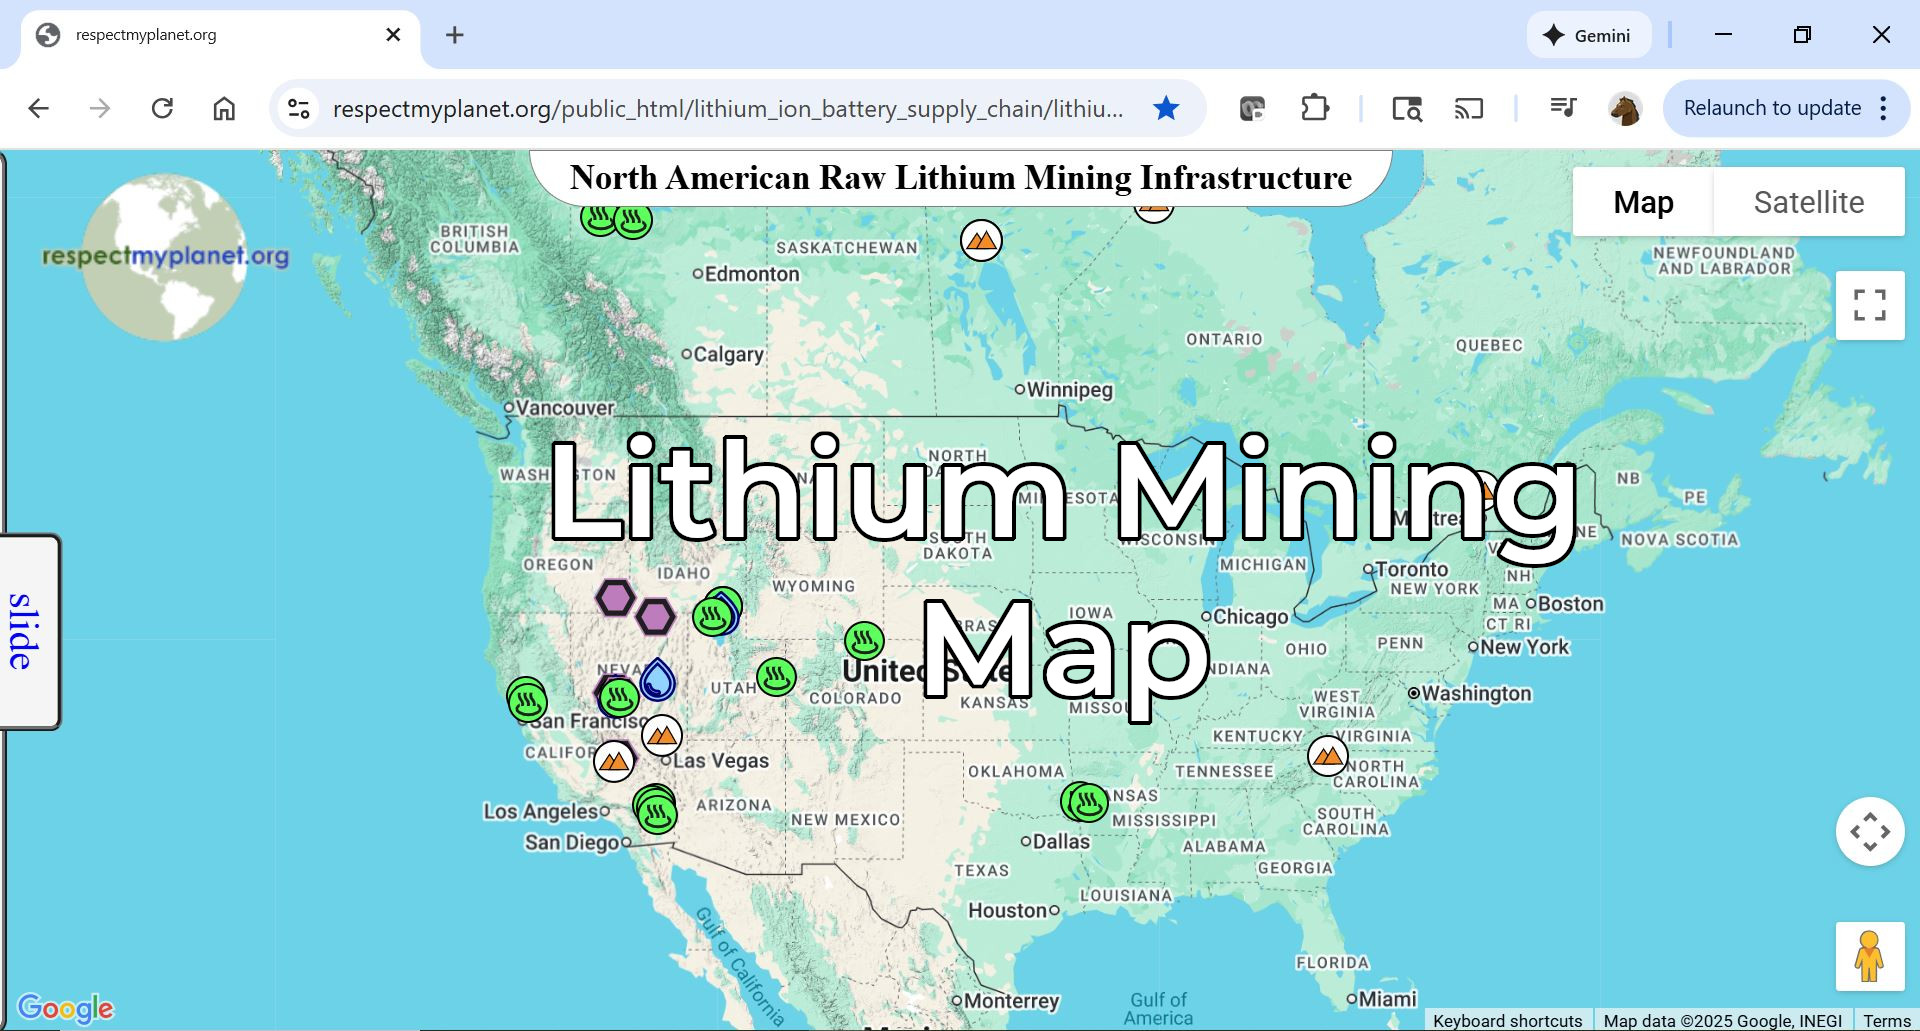
The first example of a curated “subset” map is our ‘/lithium_mining’ raw material map:
This new map answers a much narrower question:
Where are lithium raw-material projects located, and how is lithium actually extracted at each site?
From 146 Lithium Upstream Sites to 32 Focused Locations
Across upstream lithium records (i.e. raw material), the database currently contains 146 locations:
- 102 Prospects
- 16 Planned
- 19 In Development
- 9 Active
All 146 remain in the system and are available through filtering.
However, for the initial view of this curated map, the focus is intentionally narrower:
- ‘Active’ and ‘In Development’ projects are shown
- Prospects and most Planned projects are hidden at load
- Exception: four planned Direct Lithium Extraction (DLE) projects are included
That exception reflects a subjective learning goal rather than a hard rule given RMP is assigning more weight to this exciting technology. DLE is a relatively new extraction pathway, and including those projects helps illustrate how lithium production methods are evolving. If DLE scales successfully in America, we leapfrog the entire world in manufacturing ‘lithium for all’ with much more sustainable practices that protect fresh water resources.
The result of the narrow SQL query for this map is 32 visible locations — not because the others are unimportant, but because this smaller set allows the map to tell a clearer story.
RMP Uses Four Distinct Upstream Lithium Pathways
The 32 locations on this new specialty map fall naturally into four upstream lithium extraction categories, each with distinct technical, environmental, and economic implications. At RMP, we made a deliberate decision to classify upstream lithium this way—not as an abstract exercise, but to create more meaningful analytical “hooks” for querying and interpretation. This required moving beyond a single flat table and developing supplemental database structures that pair with the core NAATBatt records. By using targeted SQL JOINs, these tables allow extraction methods, development pathways, and project status to be queried together, revealing relationships that are not immediately visible when the data is viewed in isolation. The result is a framework that remains flexible, but also structured enough to support deeper, more precise questions about how lithium is actually produced.
And this approach is not limited to lithium. Lithium simply serves as the first curated example. With the underlying structure now in place, the same logic can be applied across the rest of the supply chain—from copper and nickel mining, to cathode and anode precursor production, through cell manufacturing, pack assembly, and ultimately recycling. Because these relationships are encoded in the data rather than hardwired into the map, new views can be prototyped quickly to explore different questions and perspectives. The only thing I really have to do now is decide what I want to look at and design those cool little SVG map icons which are very fun to make. In practical ‘map making’ terms, this means we can step back to see the full forest when context matters, or zoom in on individual trees when detail is required—and, importantly, move fluidly between the two using the same dataset. We have finally arrived at the fun point where the heavy lifting of building our machine is done. Now, it’s time to get creative 🙂
Speaking of designing fun new SVG icons for map markers, here are RMP’s four distinct lithium extraction categories shown on this first specialty map:
• Albemarle – Silver Peak, Nevada (Active)
• Railroad Valley Lithium Project (In Development)
• Great Salt Lake Lithium Project (In Development)
When the map first loads, all active and in development solar evaporation pond locations are displayed. The remaining 44 prospective solar evaporation projects are hidden by default. These can be turned on (and off) at any time using the control panel by checking or unchecking the boxes next to their descriptions.
• Well-established process with a proven track record, similar to the South American model.
• Relatively low energy requirements once ponds are established.
• Highly sensitive to climate conditions, evaporation rates, and water rights.
• Requires large land areas and long processing timelines.
• Provides a useful baseline for comparing newer lithium extraction techniques.
• Hell’s Kitchen Lithium & Power (In Development)
• Project ATLis (In Development)
• SWA Lithium LLC (Planned)
• TerraVolta Resources (Planned)
• NeoLith Energy (Planned)
When the map first loads, all active, in development, and planned DLE locations are displayed. Prospective locations beyond these are hidden by default but can be turned on or off through the control panel by checking or unchecking the boxes next to each description.
• Faster recovery and higher lithium yields than traditional solar evaporation ponds.
• Less land-intensive, can operate in diverse climates.
• Capital-intensive and requires careful chemical management.
• Technology is evolving; long-term operational performance is still being established.
• Strategically important for rapid deployment and near-term lithium supply.
• Thacker Pass (In Development)
• Zeus Lithium Project (In Development)
• U.S. Borax (Active)
• Nevada North Lithium Project (In Development)
• Rhyolite Ridge Mine (In Development)
When the map first loads, these five active and in-development locations are displayed. The remaining 30 prospective clay locations are hidden but can be turned on or off using the control panel checkboxes.
• Standardized, repeatable pathway using acid leaching with sulfuric acid (H2SO4).
• Enables lithium recovery from clay deposits not accessible via brine-based methods.
• Produces solid residues that require tailings or waste management systems, similar to traditional mining operations.
• Greater potential interaction with surface and groundwater, increasing the importance of water and chemical controls.
• Capital- and energy-intensive compared with solar evaporation, but expands the geographic scope of viable lithium resources.
• Albemarle – Kings Mountain, NC (Active)
• Rose Lithium-Tantalum (In Development)
• Grass River Project (Snow Lake) (In Development)
• Thompson Brothers Lithium Project (In Development)
When the map first loads, these four active and in-development locations are displayed. The remaining 29 prospective sites are hidden but can be turned on or off using the control panel checkboxes.
• Well-understood and standardized processing pathway based on crushing, flotation, and conversion.
• Provides geographically diverse and scalable lithium supply from hard-rock deposits.
• Generates waste rock and tailings typical of conventional mining operations, requiring long-term management.
• Involves greater land, labor, and energy intensity, with potential interaction with surface and groundwater resources.
• Capital-intensive with long lead times, but produces consistent, high-quality lithium products valued across the supply chain.
The Prism Concept: Many Views from One Dataset
This lithium-mining only upstream map is just one example of what is now possible with RMP’s SQL database integration and 3rd generation mapping software.
With the database structured around supply-chain logic — and supported by supplemental tables for extraction method, development stage, and processing pathway — the same data can be viewed through many different lenses:
- Upstream vs. midstream bottlenecks
- DLE-only project maps
- Active infrastructure readiness
- Recycling proximity to raw materials
- Metal-specific supply exposure
Rather than building separate datasets, the goal is to let curation emerge from querying.
Closing Thought
The full supply-chain map remains essential. It provides the universe.
Curated maps provide focus, context, and clarity — not by removing data, but by temporarily setting some of it aside so the remaining pieces can be better understood. You can search the internet for cool maps and you’ll mostly find frustratingly slow ‘haystack’ maps with no chutzpah. RMP’s maps provide not just the ‘needle’ in the haystack, but an assortment of the coolest needles possible. And because RMP’s maps are simple JavaScript (Google’s native language), our maps are fassssst.
With this new structure now established, the challenge of making new maps has shifted. The software is no longer the constraint; the analysis is. This first subset map represents a milestone moment—where the boundaries are defined not by technical limitations, but by how creatively and carefully we choose to look at the data. From here, each new map begins with a thoughtful question:
What are we trying to understand today?
That shift — from accumulation to interpretation — is where the most useful insights tend to appear. Because RMP’s mapping software is data agnostic, it means we can apply this same logic to our North American Hydrogen Infrastructure Map, our Global LNG Map, our Ann Arbor 1,4 Dioxane Plume Map, and any other map we can dream up.
Please Support Our Independent Non-profit Research
RespectMyPlanet (RMP) is a registered United States 501(c)(3) nonprofit organization located in Michigan, and for more than 15 years we have been building maps, databases, and open-ended software tools dedicated to understanding and protecting water resources. Michigan is home to approximately 20% of the world’s fresh water, our most precious resource. The lithium-ion battery supply-chain mapping effort you see here is a natural extension of that long-standing work: applying careful data curation and transparent analysis to complex systems that directly affect water, land, and communities.
Like many small research nonprofits, RMP operates with extremely limited financial resources. Over the past several years, we have averaged essentially zero revenue while continuing to absorb hosting costs, software expenses, and the administrative fees required to maintain our 501(c)(3) status. As we approach our 14th anniversary as a nonprofit, we remain committed to keeping this work independent, data-driven, and publicly accessible—but doing so increasingly depends on support from readers who find value in these tools.
If you pay taxes in the United States, donations to RMP are tax-deductible, and any level of support helps sustain the research, infrastructure, and time required to continue improving these maps and expanding their analytical depth. If this work has helped you better understand the energy transition, water use, or critical-materials supply chains, we would be grateful for your consideration in supporting its continuation. Please click here to make a secure and tax-deductible donation to RMP.
Leave a Reply