This quarterly report chronicles key H2 infrastructure developments & stories from the past three months and is published on the last day of the quarter. Each key news item will be highlighted with a synopsis of the key event, a link to the story, and a link to its location on RMP’s Google map of hydrogen infrastructure across the USA & Canada if applicable. Simply click the map link to go directly to a zoomed in map marker on RMP’s map of H2 infrastructure. The marker on the map will be used as a virtual data repository for that specific location (like a Wiki page for that location). If you want to learn more about what’s going on at that location, you can go to its homepage to get all information available for that location.
This month (December 2021), RMP added all the legacy hydrogen production infrastructure and pipelines along the Gulf Coast from New Orleans in the East to Lake Charles, Port Arthur, and Houston to the west. Production locations and pipelines in Corpus Christi were added as well! A ton of new infrastructure was added to RMP’s map. RMP will be publishing a “Gulf Coast” version of our hydrogen map soon to the world wide web along with videos showing just how much information is there for you to use & view on our map platform.

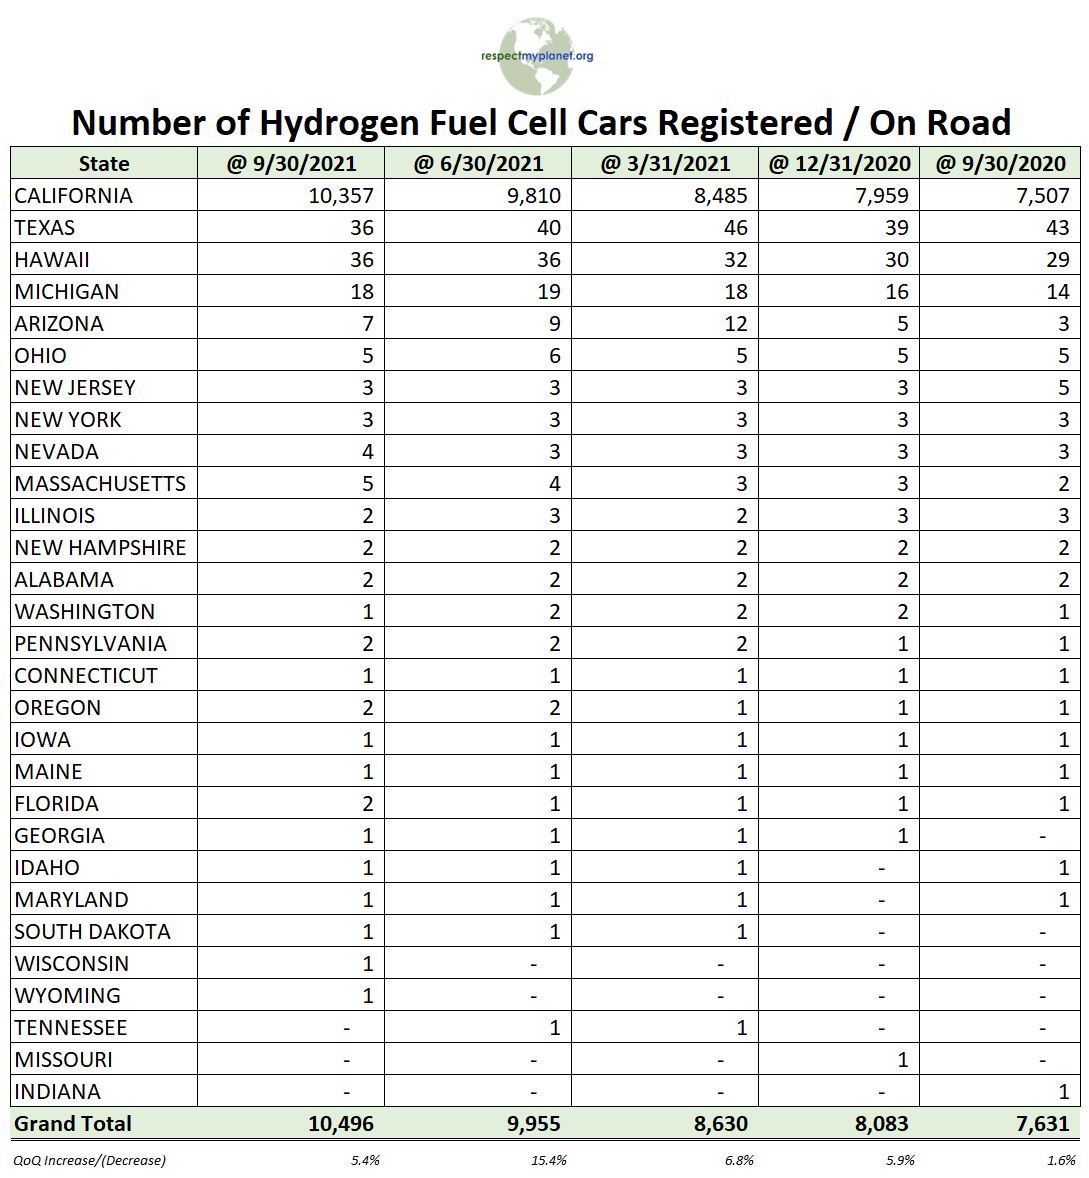
FCEVs Registered in the USA
FCEV registration reporting lags behind about two months. So for example, 9/30/2021 data gets published by IHS Worldmarkit about the second week in November of 2021. Therefore, 9/30/2021 is the most current data RMP can report on 12/31/2021. The tables below show the most current FCEV registration data in the USA by state and in California by county. For the first time ever, California now officially has over 10,000 FCEVs registered on California roads.

That’s a wrap on 2021. Thanks for reading and Happy New Year! See you next quarter.
Leave a Reply