Tag: hydrogen
-
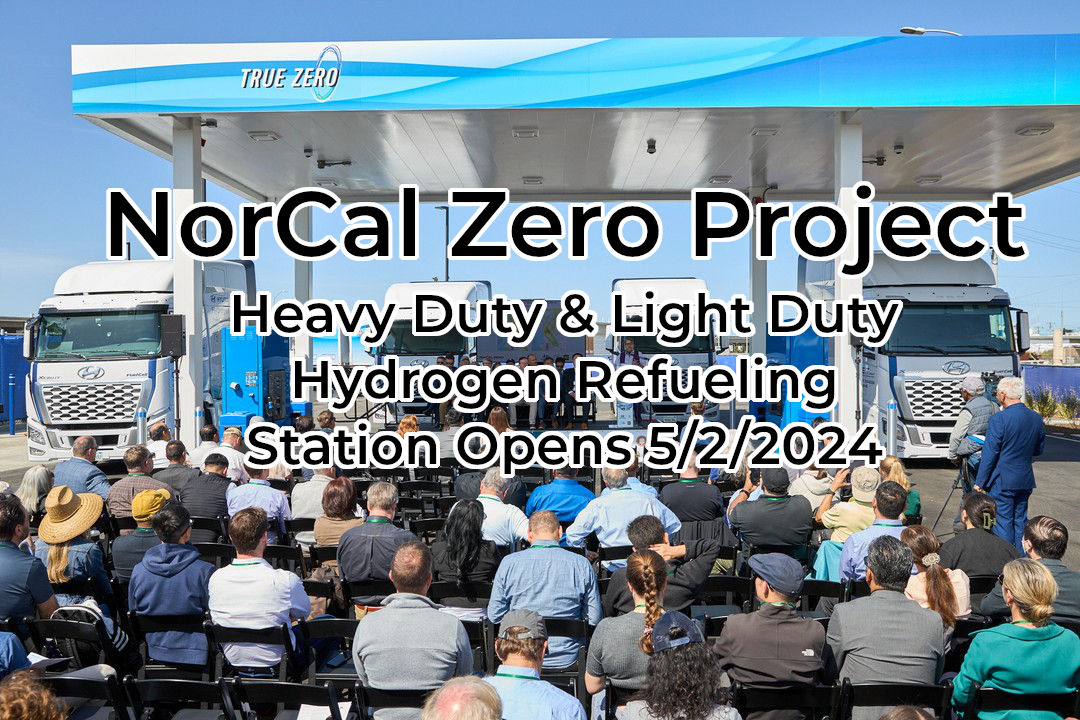
NorCal Zero Project
It is a milestone day for hydrogen refueling. The Center for Transportation and the Environment announces the inauguration of the NorCAL ZERO project. This new station can serve up to 200 Class 8 heavy duty trucks per day. It has a capacity of 4,000 kilograms of LH2. The station also can refuel class 1 vehicles and…
-
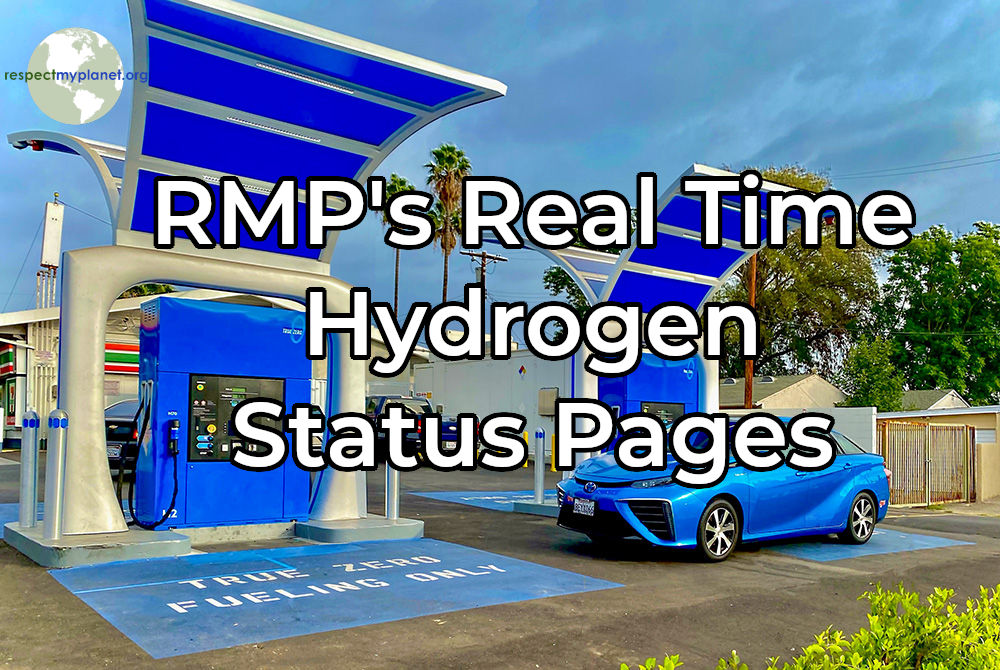
RMP’s Real Time Hydrogen Station Status Pages
RMP has upgraded our California hydrogen maps by including a new map for real time station status and a new map for stations coming soon. All stations reporting SOSS status in California are summarized on our landing page at this link and shown below (Figure 1 ). All of the pages covered in this post…
-
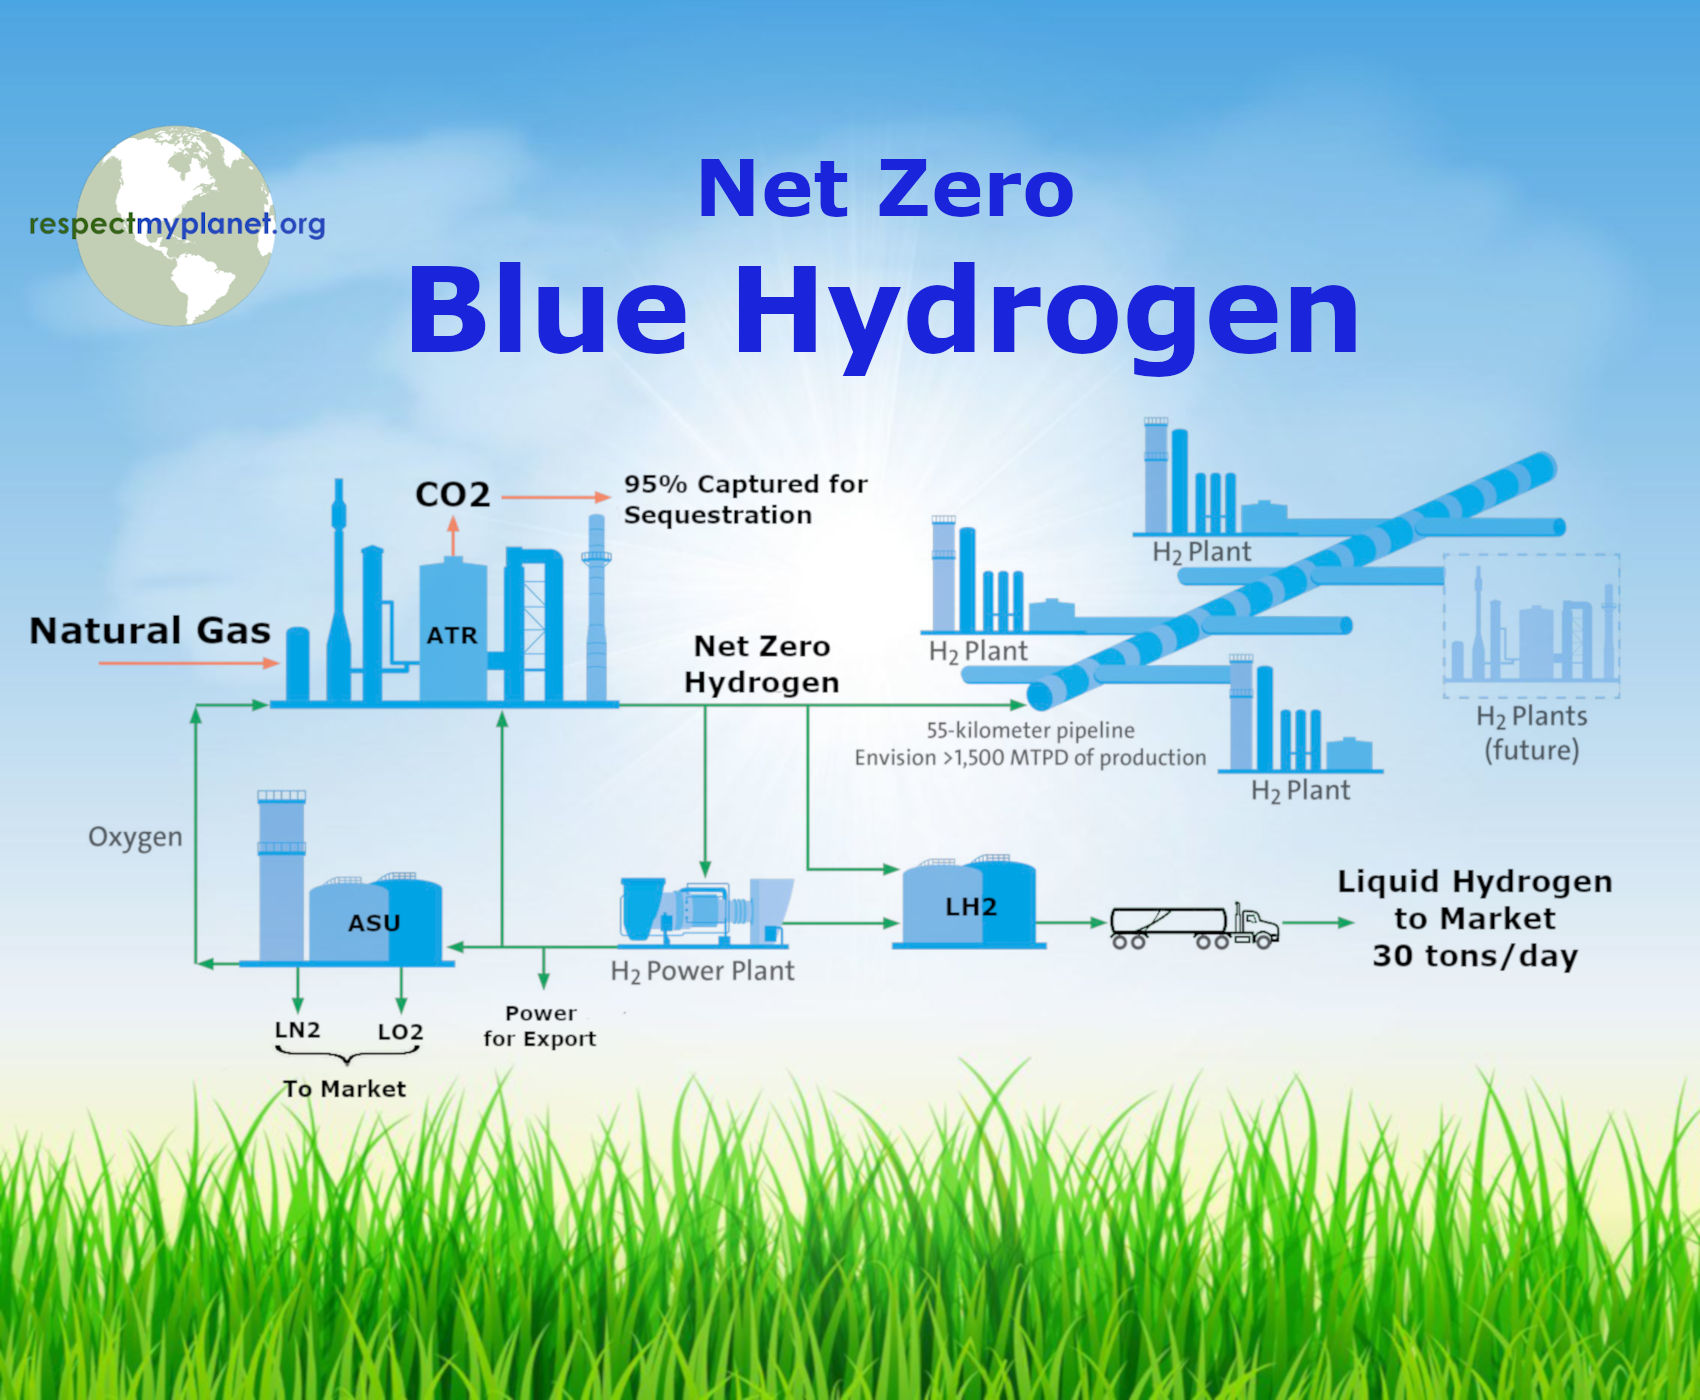
The Truth About Blue Hydrogen
Blue hydrogen is a net zero way of making hydrogen for cars, trucks, boats, ammonia, or anything for that matter. This means a lot of energy produced with no CO2, NOx, SOx, or particulate emissions. Recently some big announcements came out about blue hydrogen investments in Edmonton & Louisiana. These big announcements prompted anti-hydrogen critics…
-
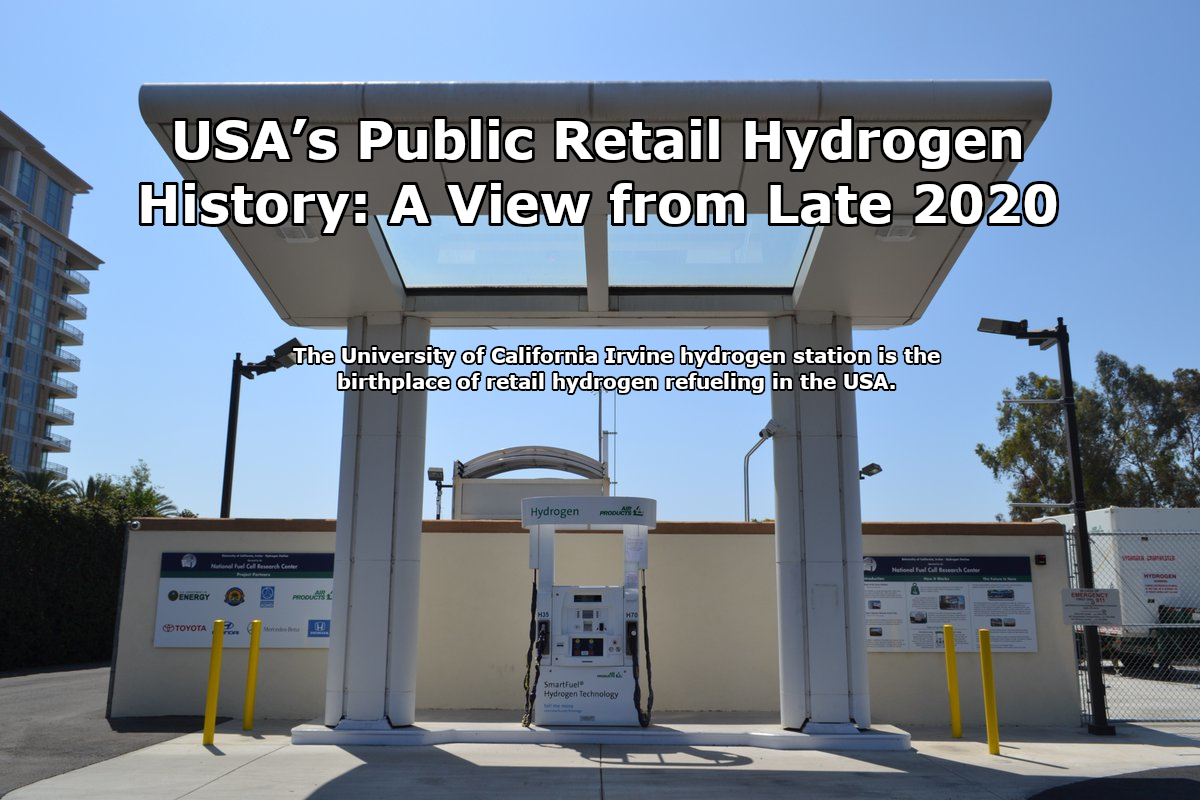
USA’s Public Retail Hydrogen History: A View from Late 2020
The new hydrogen stations opening in California are not like the ones from four years ago, they’re massive. These new stations have 1,200kgs of capacity & can be replenished in a couple of hours and keep on refueling. These new stations mark a step change in hydrogen refueling scale and represent a great time to…
-
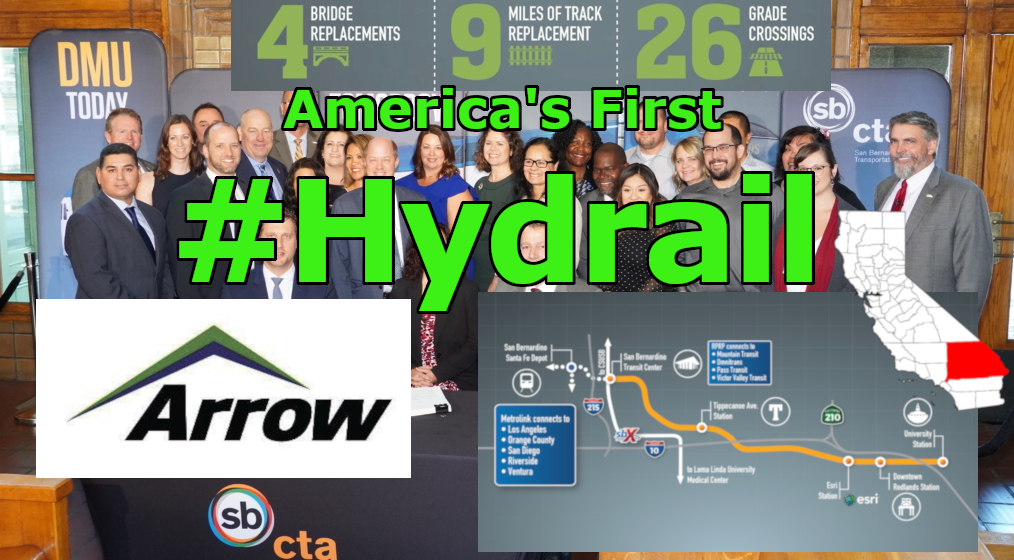
USA’s First Hydrogen Passenger Rail – San Bernadino California
The Redlands Rail Project has commenced in California and soon will host the USA’s first hydrogen powered train. Not only that, Michigan State University played an important role in helping the San Bernadino County Transportation Authority decide on using hydrogen fuel cells. Click through to learn more about the first #hydrail project in America &…
-

USA & CANADA QUARTERLY H2 INFRASTRUCTURE UPDATE 2018-Q4
We end 2018 with 3 new hydrogen refueling stations opening in California in the last week of the year. We have 22 stations planned to open in California in 2019. Click through to read about hydrogen infrastructure updates in the USA & Canada in 2018-Q4 and our outlook into 2019.
-

USA & Canada Quarterly H2 Infrastructure Update 2018-Q3
Check out RMP’s latest new post covering hydrogen infrastructure developments occurring over the past three months from June 30, 2018 to September 30, 2018. In this quarter’s report we look at two new public hydrogen stations that opened in Hawaii & Vancouver British Columbia. Click here to read all about how hydrogen fuel cell infrastructure…
-

Quarterly USA H2 Report Becomes Quarterly USA & Canada H2 Report
RMP is based near Detroit, Michigan. The Detroit River separates the City of Detroit & the City of Windsor. The Ambassador Bridge connects the two cities and soon the Gordy Howe International Bridge, a once in a generation undertaking, will be a second major bridge connecting the two cities. Windsor is my personal connection to…
-

USA Quarterly H2 Infrastructure Update 2018-Q2
H2 infrastructure is growing all across the USA and especially in California. New H2 stations are planned all across the East Coast too. RMP will now regularly be publishing a quarterly update of H2 infrastructure all across the USA to keep our readers informed of what’s going on. Check out our USA H2 Infrastructure Quarterly…
-

Coal Use Forecasted To Rise – How We Can Mitigate Coal Pollution
Coal use is growing across the world. Coal will eventually surpass oil as the #1 primary energy source for world energy consumption. Over 1.3 billion people around the world do not have electricity and they will be planning on building coal fired power plants as a cornerstone to their energy plan. We can either understand…